GTYR up 50% in three months, is there more upside?
In this blog post, we will delve into the technical analysis of Ghandhara Tyre & Rubber Company Limited (GTYR).
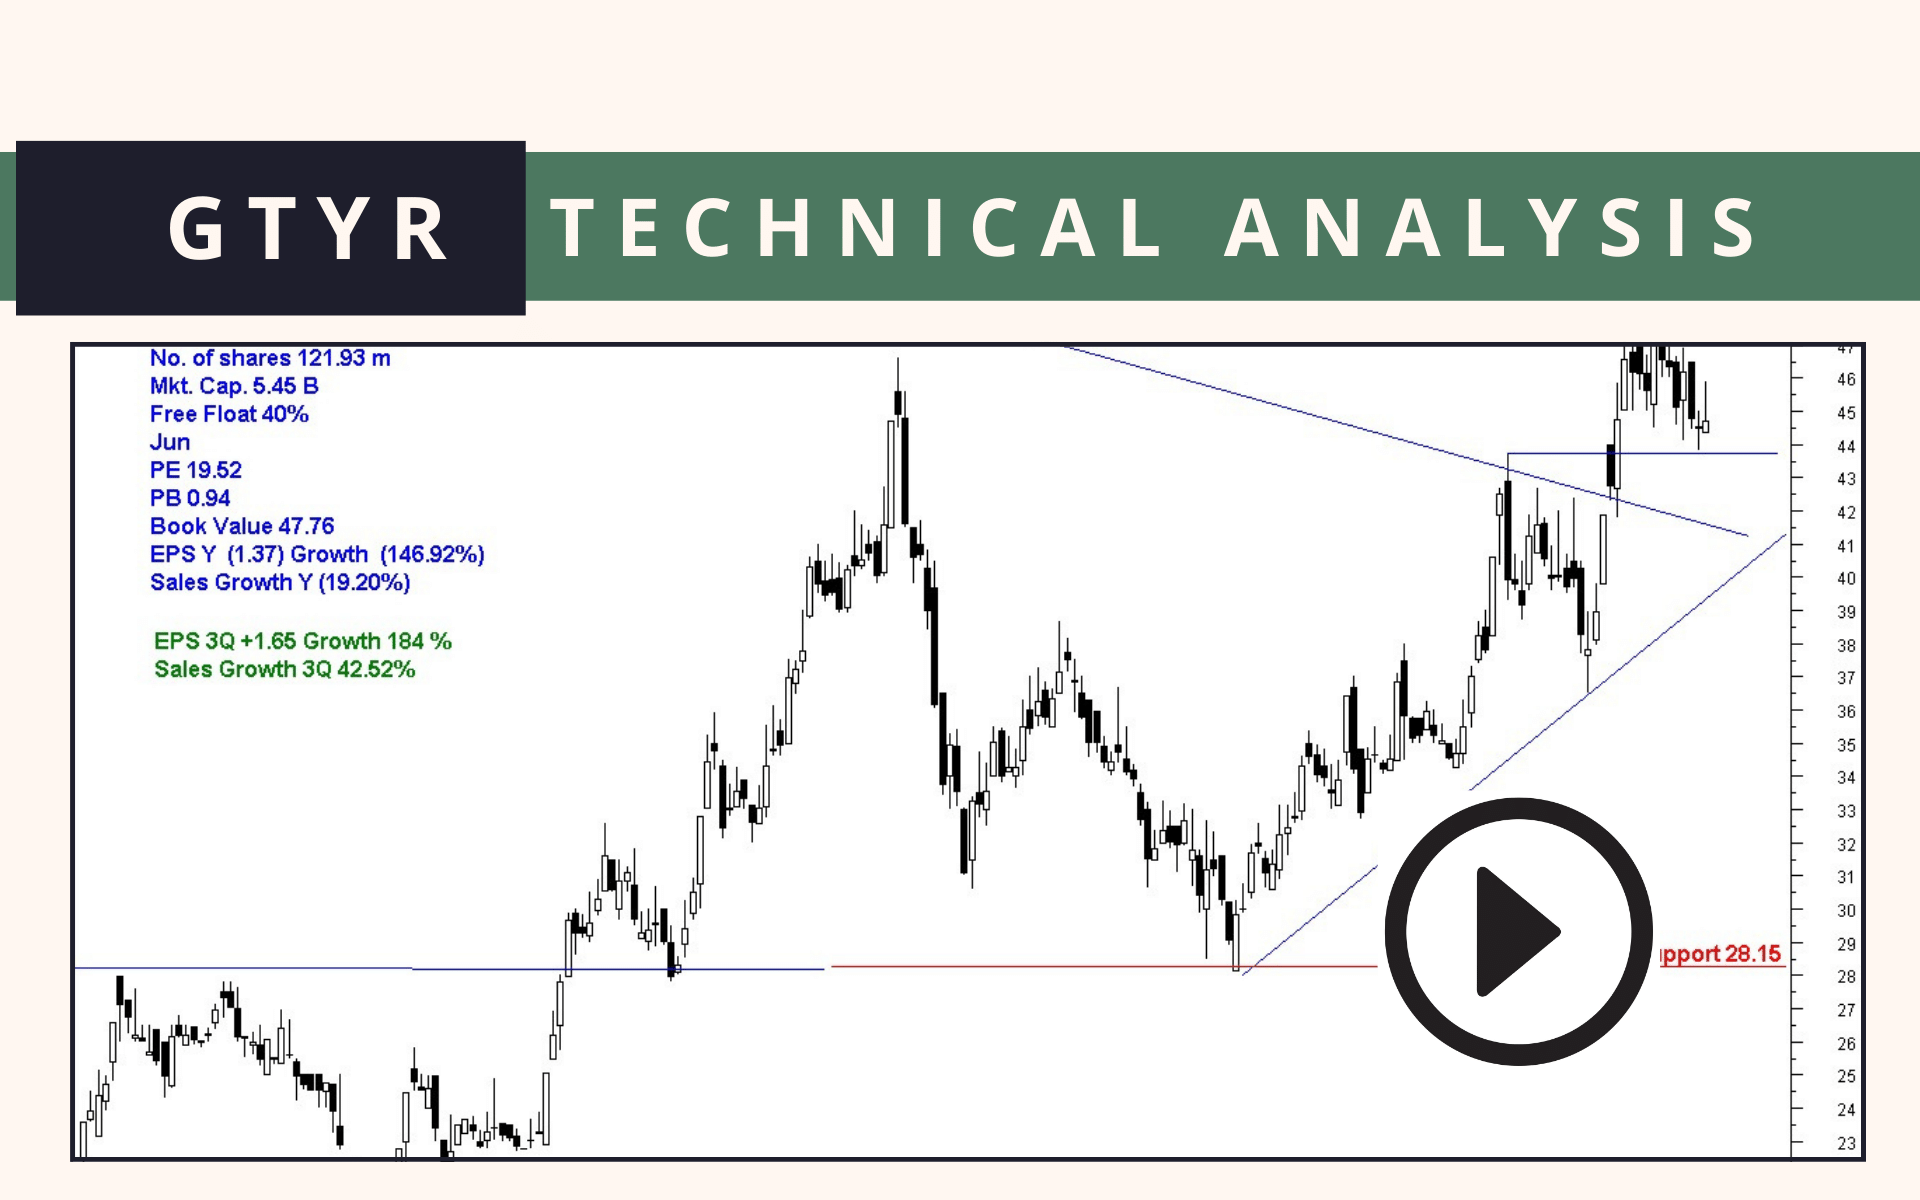
Here is my detailed audio analysis.
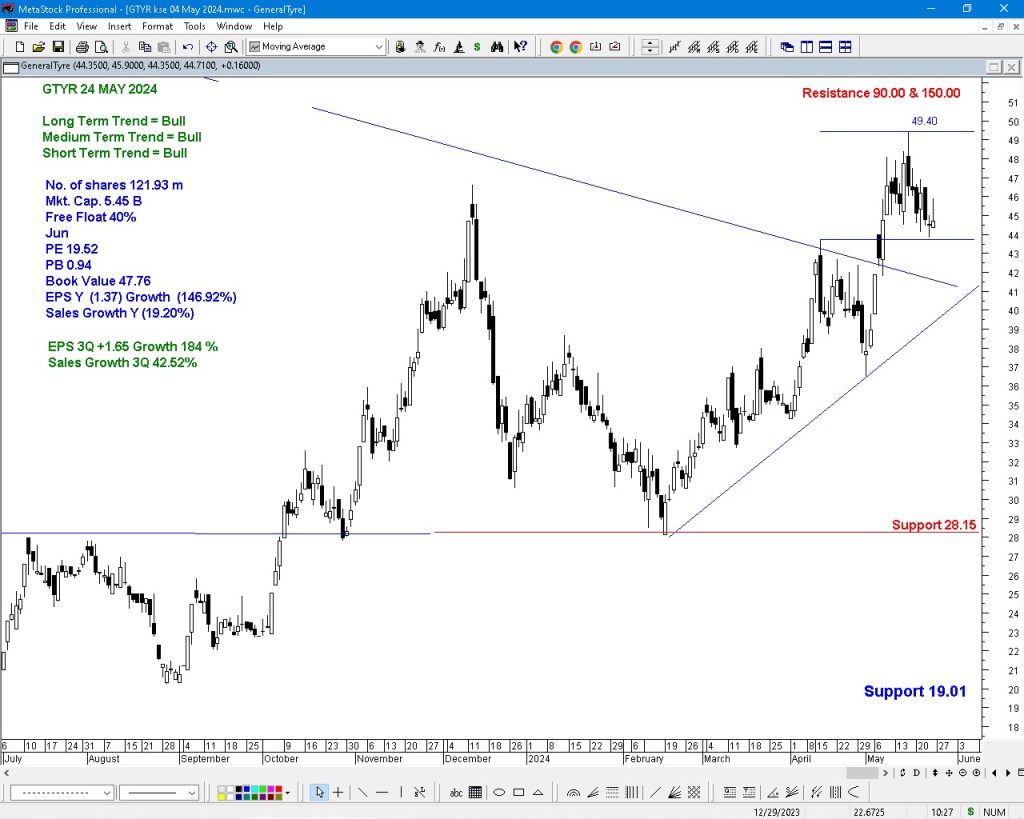
Long term trend has just started and is bullish.
Medium trend is also bullish.
In the short term, it has stopped at resistance.
Long term resistance stands at Rs. 90 and Rs. 150.
A good accumulation point could be between Rs. 19 and Rs. 28.
But if this opportunity doesn’t come, look for a price pattern formation over a few months.
Once that pattern breaks out, it could be a good point for entry.
Company’s EPS was negative last year. Sales trend also down. These are not good signs but so far in last 9 months, company already has a positive EPS.
Sales are now showing 42% growth.
These are positive signs on a fundamental level.
Since mid-Feb, it has remained in a bullish trend.
Mr. Israr Ul Haq is a highly experienced and respected technical trader with over 25 years of expertise in the Pakistan Stock Exchange (PSX). He has developed a deep proficiency in reading and interpreting chart patterns, technical indicators, and market trends, which has been instrumental in his sustained success over the decades. He also operates in the Turkish Stock Exchange(Borsa Istanbul).
He can be reached through his WhatsApp Debate Group.

Leave a Reply