
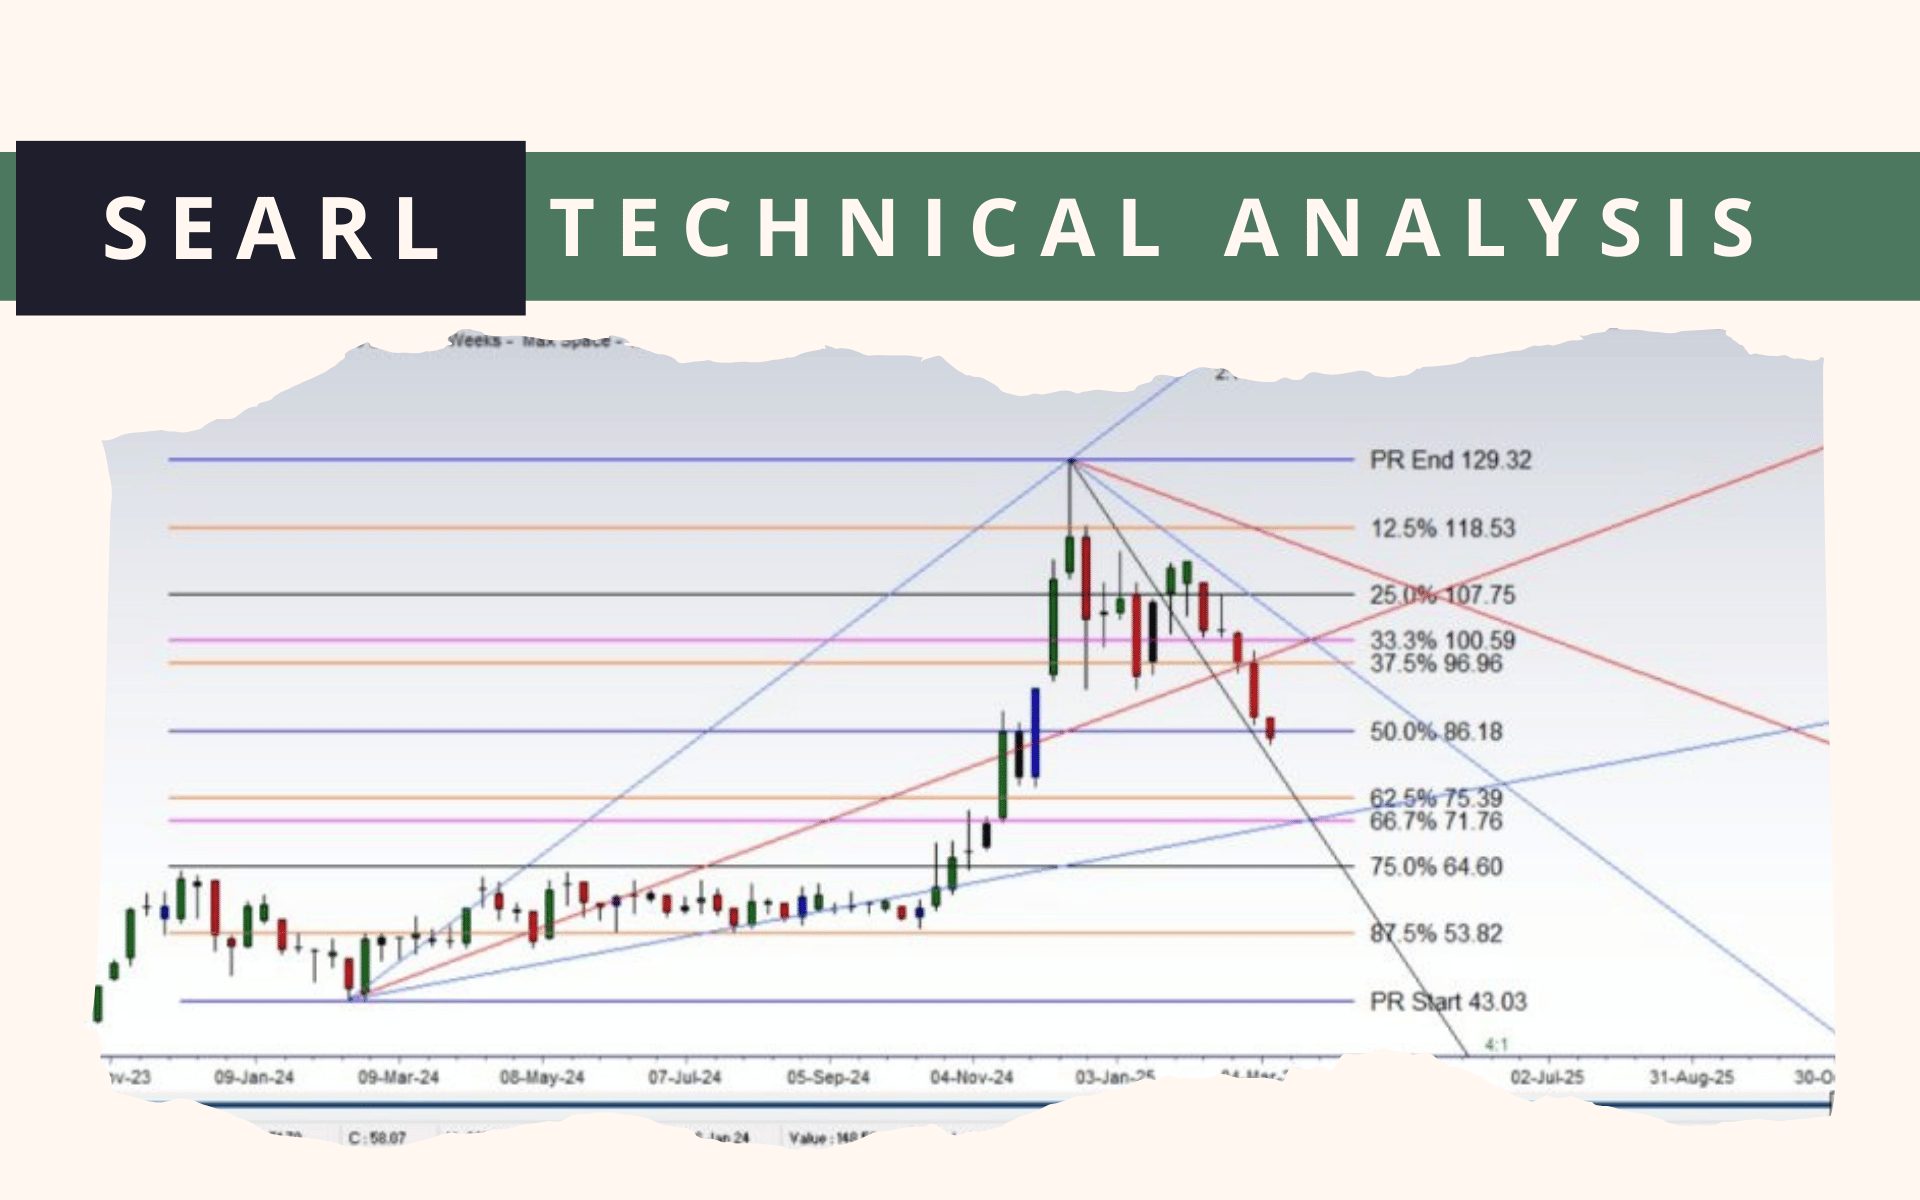
The Searle Company (SEARL) geometrical analysis
Every low & high has a geometrical relationship that can be plotted on charts for forecasting prices. Geometrical relation from 43.03 low with 129.32 high is 1:4 Angle or 0.25 points per day.

Second geometrical relation or important cycle from 54.80 low with 129.32 high is 1:1 Angle or 1 point per day. The intersection of these two angles was exactly where the top of 129.32 formed and a bear cycle started.
1:8 Angle from 43.03 low, 1:4 angle from 54.80 and 1:2 angle from high of 129.32 have intersected. if the market opens above 1:8 and 1:4 angle, it will indicate a bullish move on the daily chart.
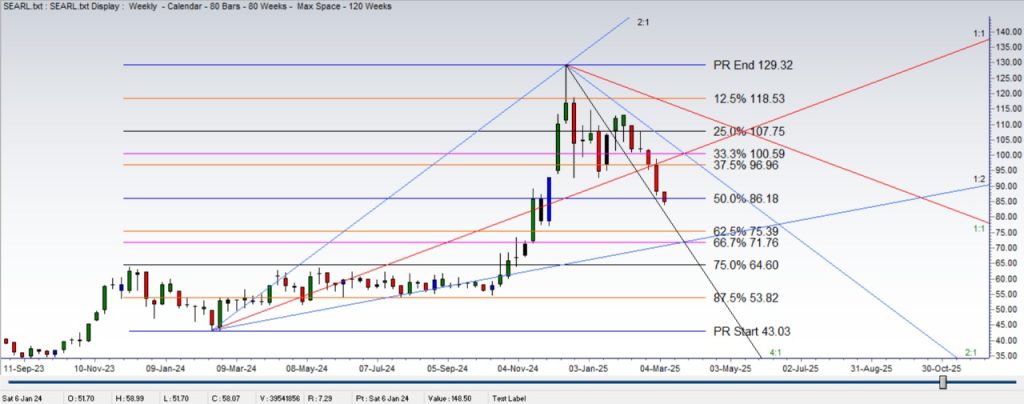
To nullify bearish move on SEARL weekly chart, the Price must reach 1:1 (red angle) drawn from 129.32 high.
Reaching 1:1 will indicate price is declining at 1 point per week. Price is still below 2:1 Angle indicating a fall of more than 2 points per week.
⚠️ This post reflects the author’s personal opinion and is for informational purposes only. It does not constitute financial advice. Investing involves risk and should be done independently. Read full disclaimer →


Leave a Reply