
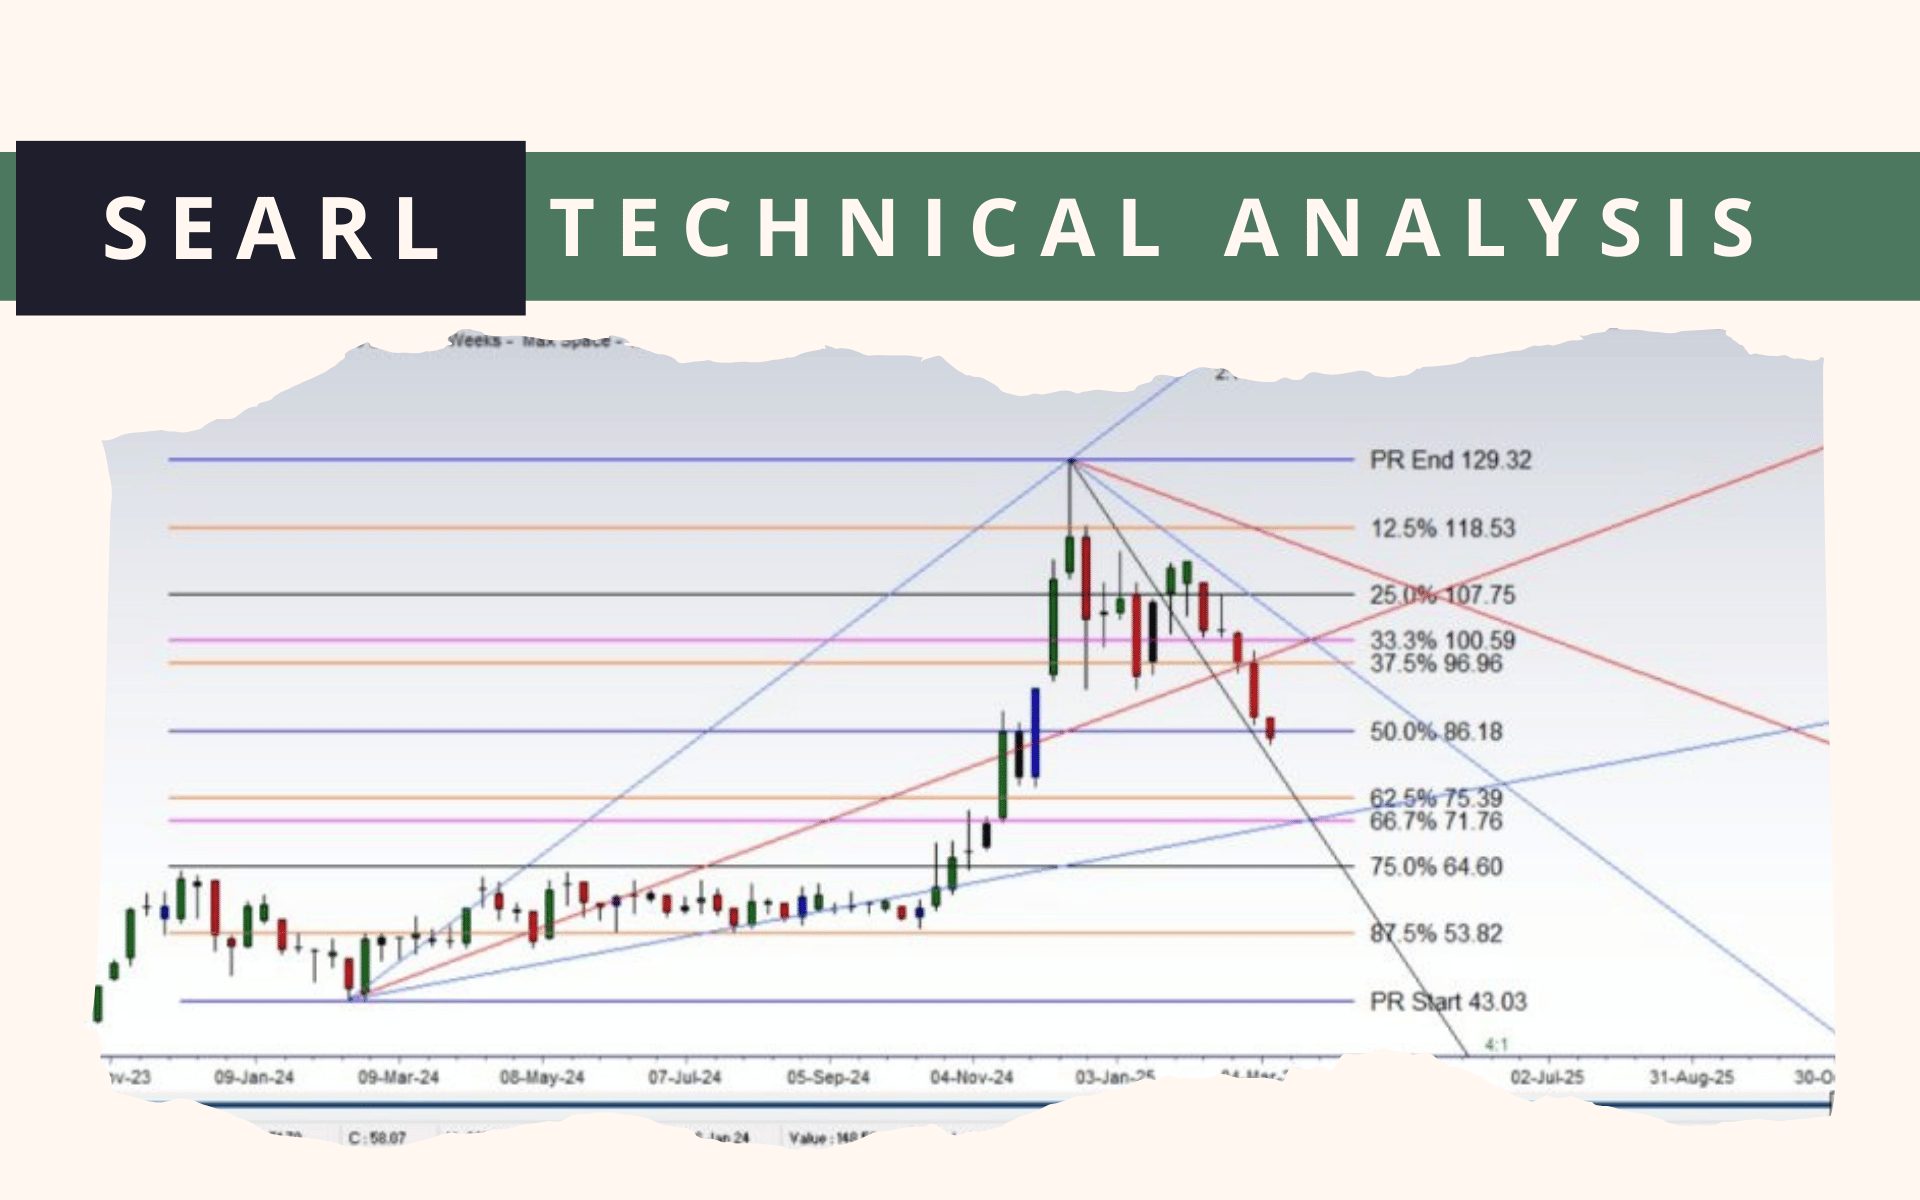
The Searle Company (SEARL) geometrical analysis
Every low & high has a geometrical relationship that can be plotted on charts for forecasting prices. Geometrical relation from 43.03 low with 129.32 high is 1:4 Angle or 0.25 points per day.

📢 Announcement: You can now access our services and similar analyses by opening an account with us via JS Global

Second geometrical relation or important cycle from 54.80 low with 129.32 high is 1:1 Angle or 1 point per day. The intersection of these two angles was exactly where the top of 129.32 formed and a bear cycle started.
1:8 Angle from 43.03 low, 1:4 angle from 54.80 and 1:2 angle from high of 129.32 have intersected. if the market opens above 1:8 and 1:4 angle, it will indicate a bullish move on the daily chart.
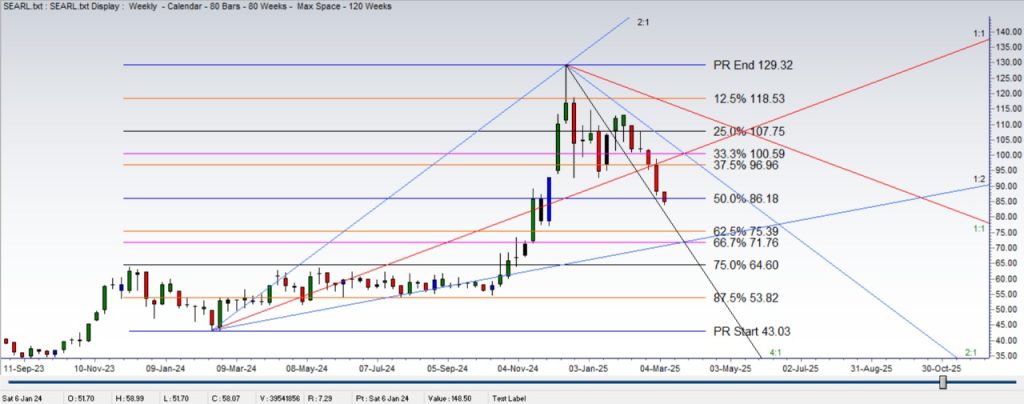
To nullify bearish move on SEARL weekly chart, the Price must reach 1:1 (red angle) drawn from 129.32 high.
📢 Announcement: We're on WhatsApp – Join Us There!

Reaching 1:1 will indicate price is declining at 1 point per week. Price is still below 2:1 Angle indicating a fall of more than 2 points per week.
⚠️ This post reflects the author’s personal opinion and is for informational purposes only. It does not constitute financial advice. Investing involves risk and should be done independently. Read full disclaimer →


Leave a Reply