
Posted by: Syed Waqas Jaffri
Post Date: April 29, 2025
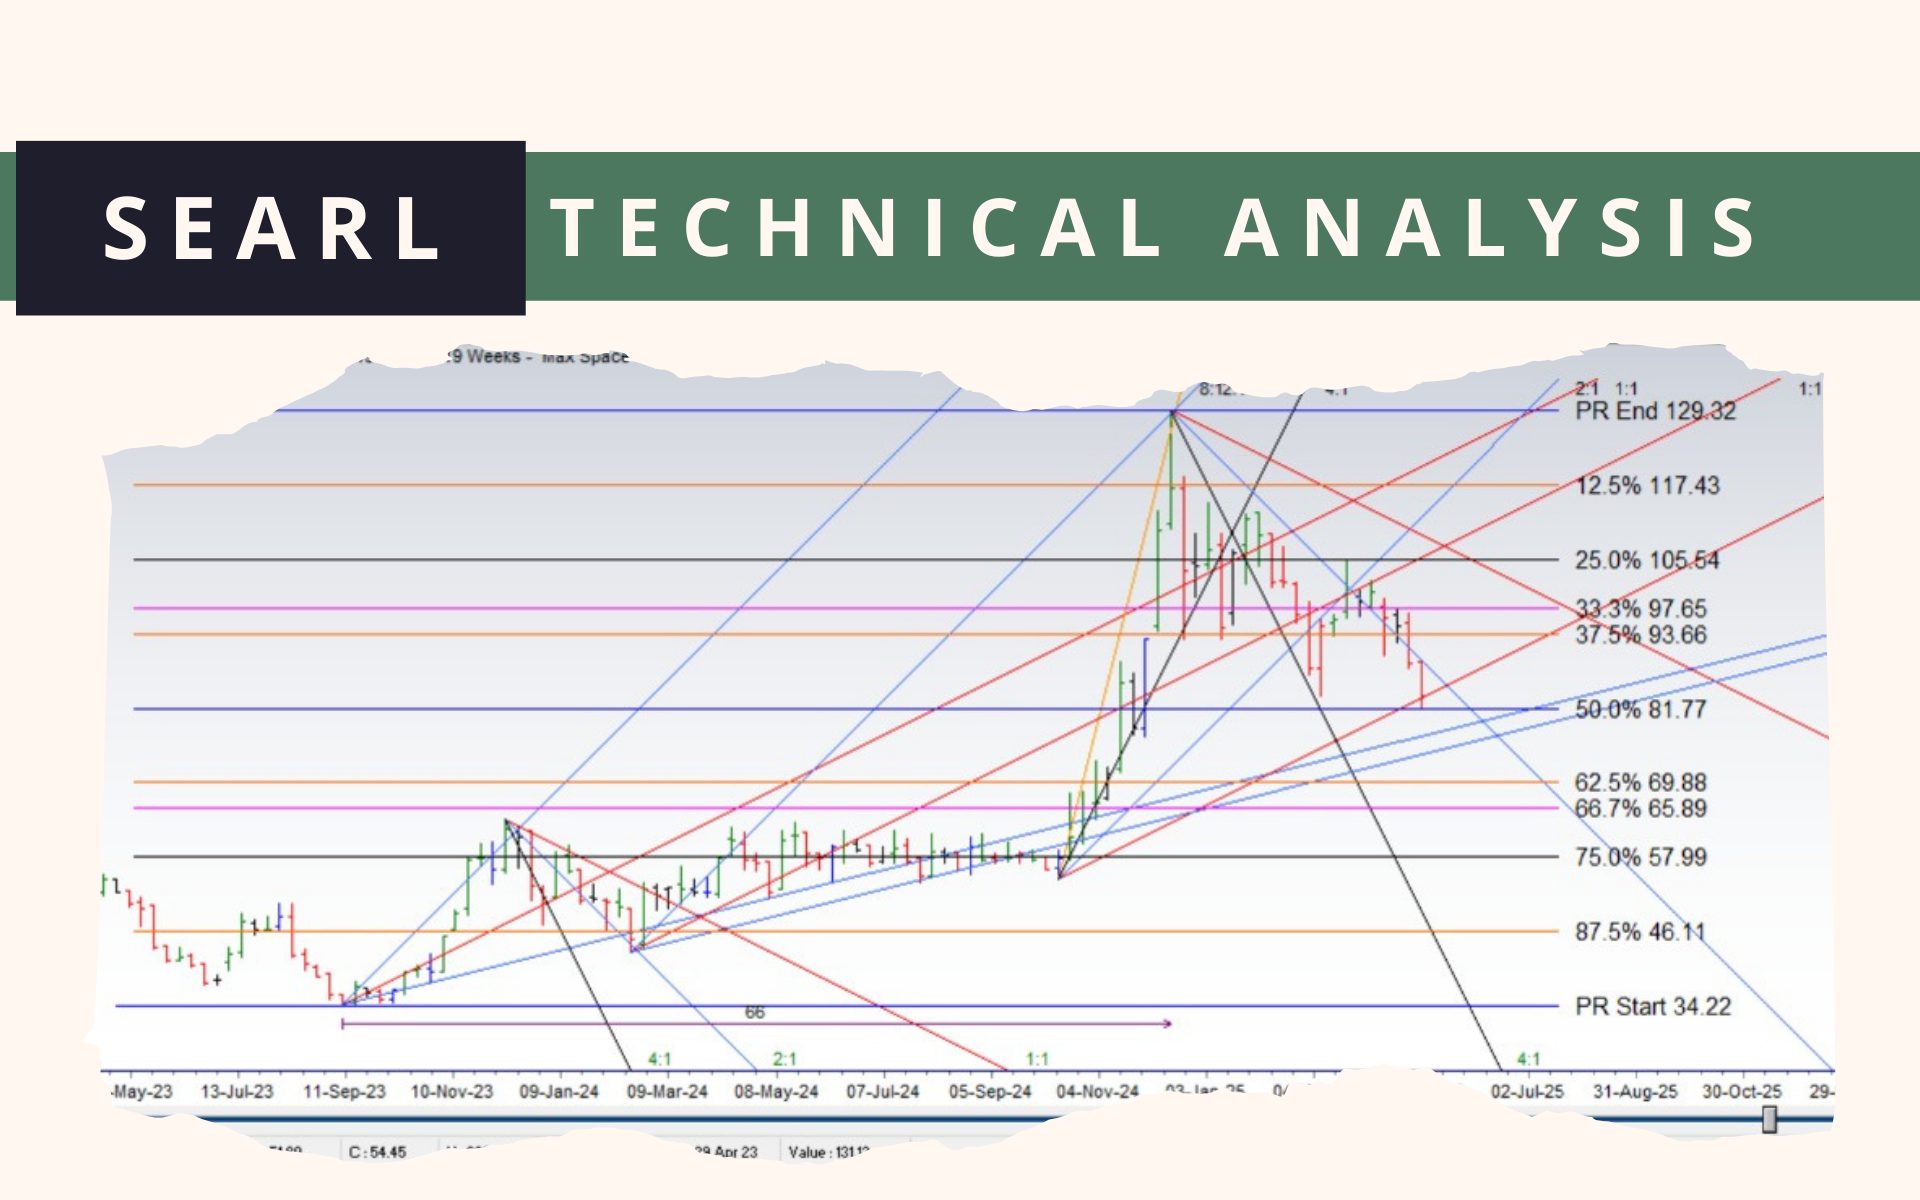
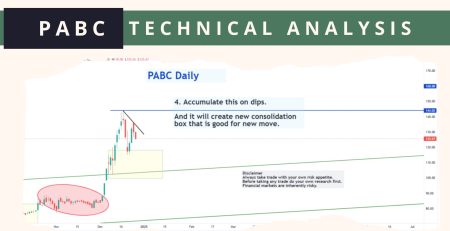
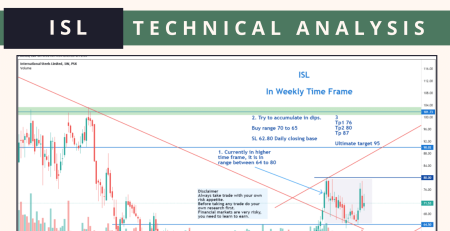
SEARL Technical Analysis
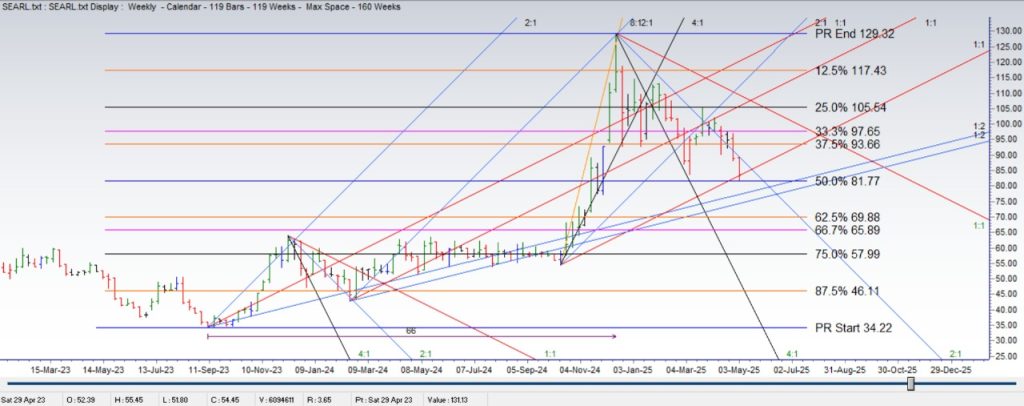
SEARL 66-week range 34.22-129.32=95.1
First Major Support of this Range is 50% 81.77
Moving below the 2:1 line indicates a fall of 2 points per week since the high of 129.32
The Searle Company Limited demonstrates strong revenue growth and operational efficiency. However, the significant net loss in FY 2024 and negative return ratios highlight areas of concern.
Key Financial Ratios
- Price-to-Earnings (P/E) Ratio: Negative, due to net losses
- Price-to-Sales (P/S) Ratio: 1.49
- Price-to-Book (P/B) Ratio: 1.23
- Return on Equity (ROE): -6.90%
- Return on Assets (ROA): -3.74%
- Current Ratio: 1.61 (indicating adequate short-term liquidity)
Investment Considerations
Strengths:
- Consistent revenue growth with a 13.97% increase in FY 2024.
- Strong gross and EBITDA margins, indicating operational efficiency.
- Recent quarterly turnaround with a return to profitability
Risks:
- Significant net loss in FY 2024 due to impairment losses.
- Negative ROE and ROA, reflecting challenges in generating returns.
- No recent dividend payouts, which may affect income-focused investors.
⚠️ This post reflects the author’s personal opinion and is for informational purposes only. It does not constitute financial advice. Investing involves risk and should be done independently. Read full disclaimer →
Leave a Reply