
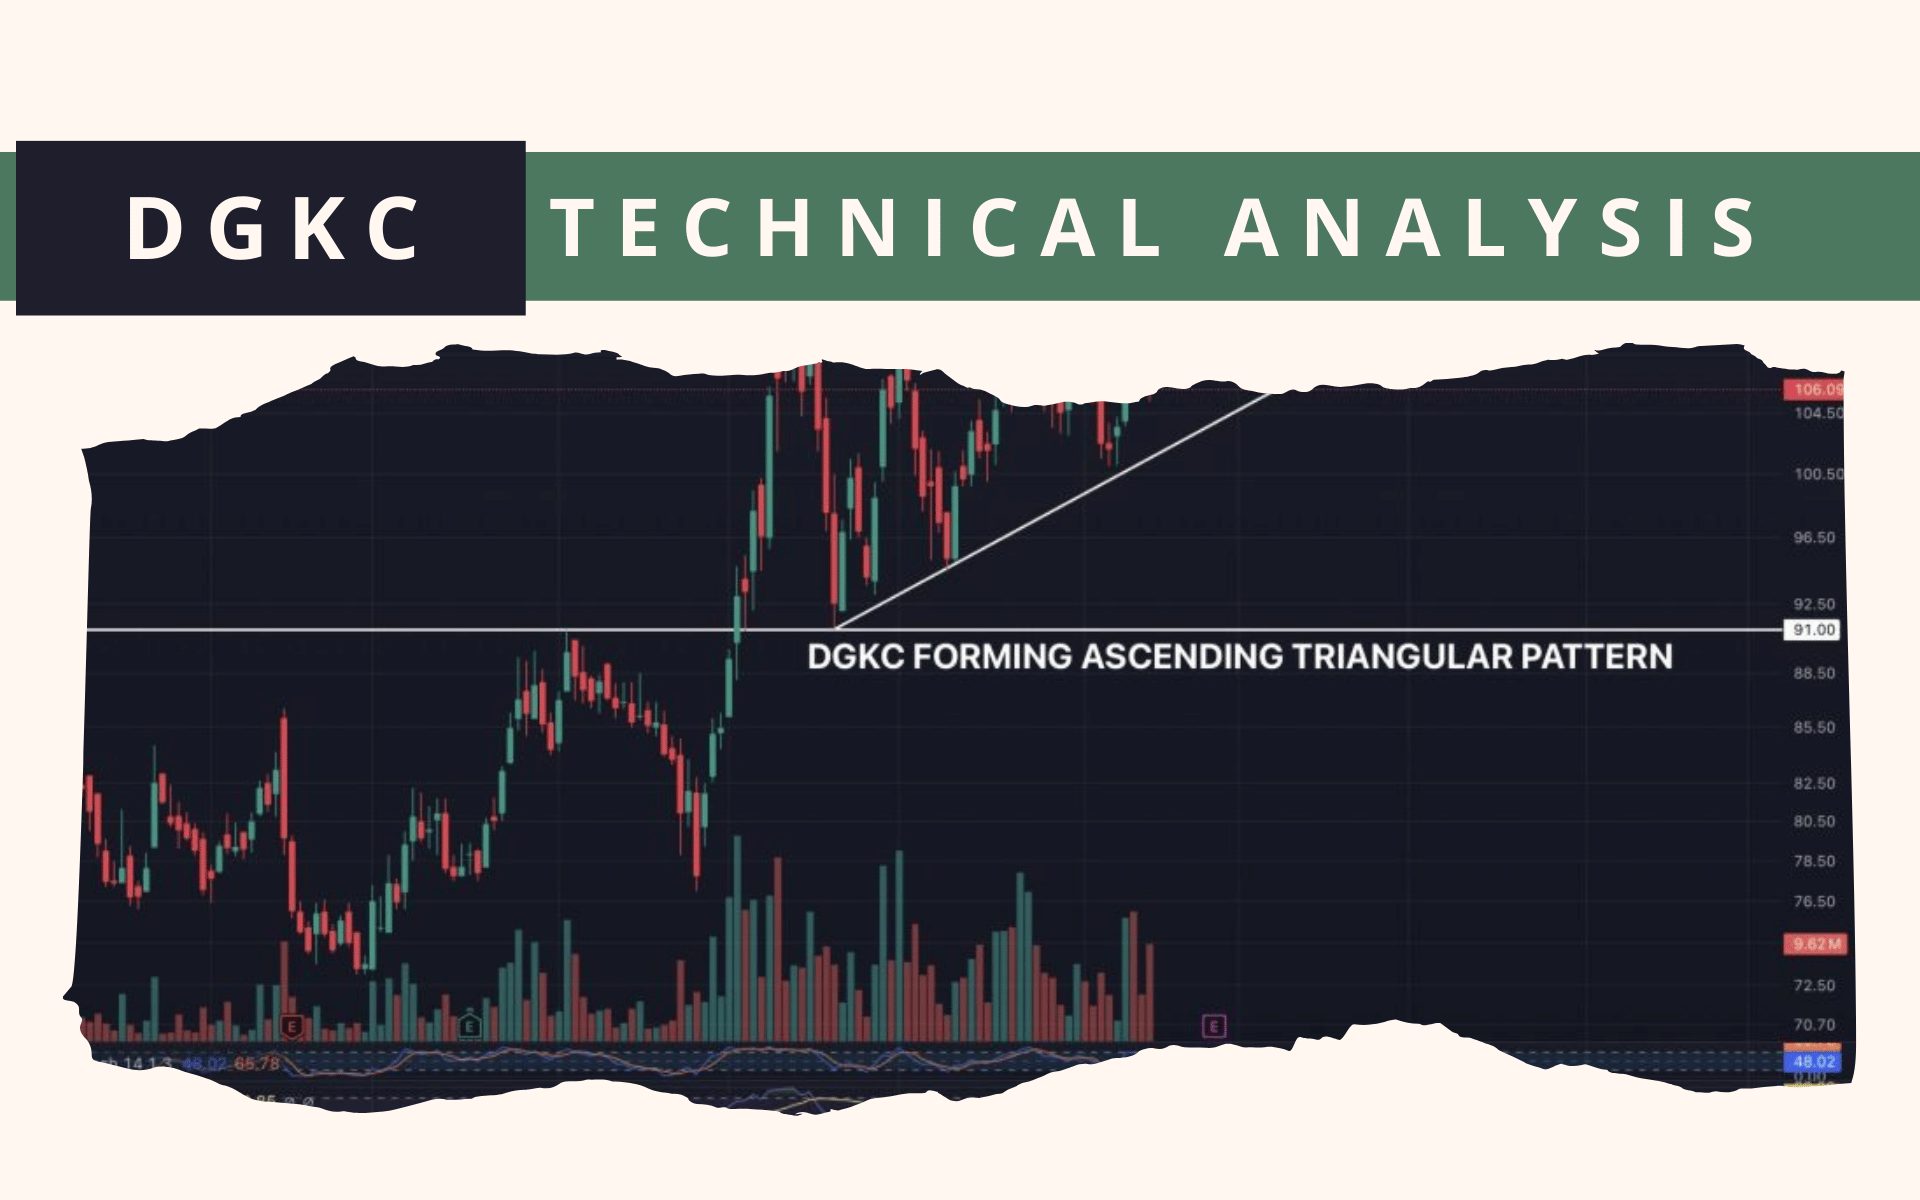
D.G. Khan Cement Company (DGKC) is forming an ascending triangular pattern
D.G. Khan Cement Company (DGKC) is forming an ascending triangular pattern. A break above the resistance of 112.5 can trigger further rally. It is also possible that the share further continues to consolidate, staying range bound, before breaking out. In case it forms a rectangular pattern, key support lies at 94 and 90.

On the monthly timeframe, the stock has been creating new higher highs and higher lows, indicating a bullish trend, with the next resistance at 143. A long position can be taken once, price breaks 112.5 and targets can be set to 127.75 and 140-143.
📢 Announcement: You can now access our services and similar analyses by opening an account with us via JS Global


With Interest rates continously falling and a good result being expected, this can be a good stock to keep an eye on.
Disclaimer
The above should not be taken as financial advice.
📢 Announcement: We're on WhatsApp – Join Us There!

⚠️ This post reflects the author’s personal opinion and is for informational purposes only. It does not constitute financial advice. Investing involves risk and should be done independently. Read full disclaimer →


Comment (1)
Good Information