
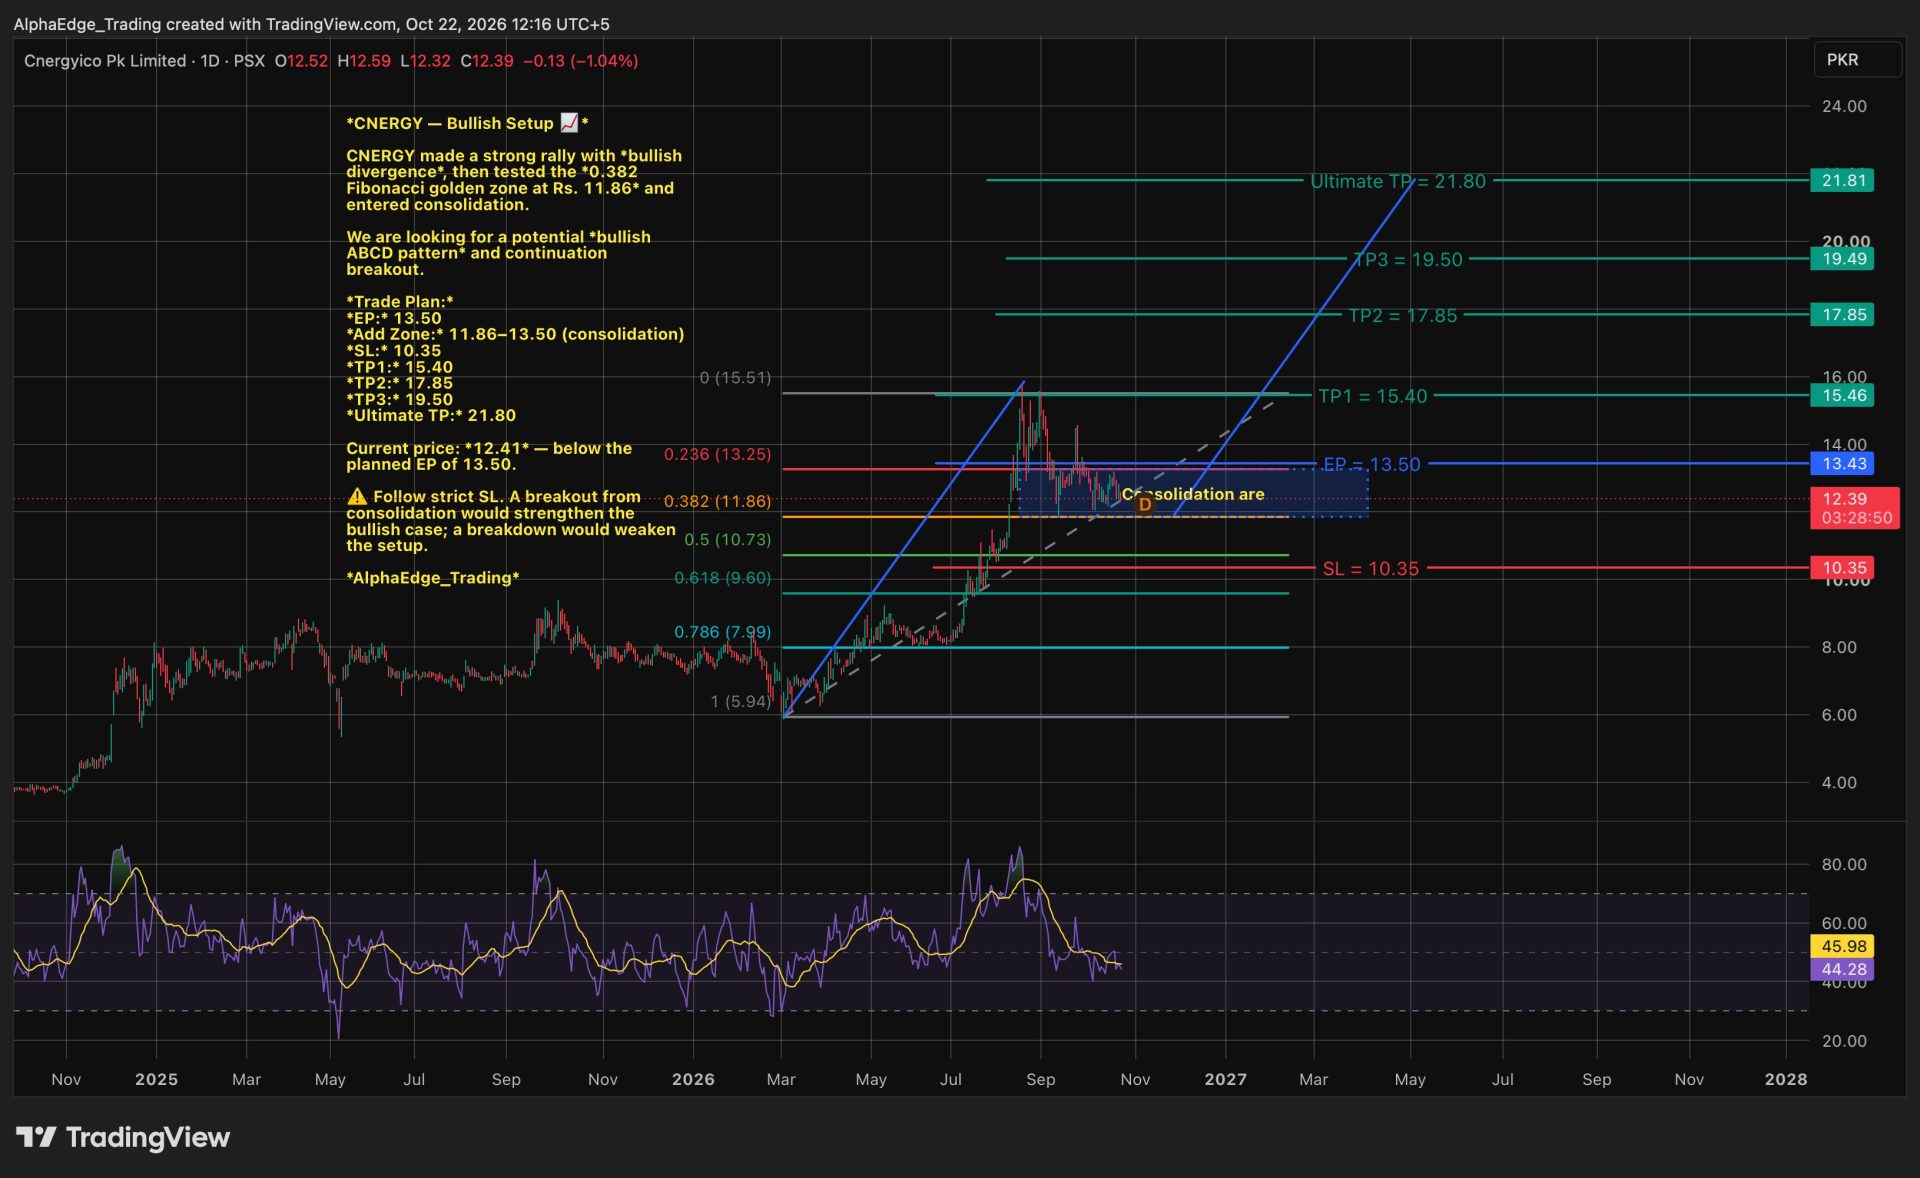
CNERGY — Bullish Divergence and Potential ABCD Formation
Cnergyico Pk Limited (PSX: CNERGY) has staged a strong rally, accompanied by bullish divergence. Following the advance, price retraced to the 0.382 Fibonacci level at Rs. 11.86, within the marked golden zone, and subsequently entered consolidation.
The consolidation may provide a base for another bullish leg. The chart also outlines a potential ABCD continuation pattern, with a projected move toward the previous resistance area and higher Fibonacci-based targets.
Trade Setup
- Entry (EP): Rs. 13.50
- Consolidation Zone: Approximately Rs. 11.86–13.50
- Stop-Loss: Rs. 10.35
- Target 1: Rs. 15.40
- Target 2: Rs. 17.85
- Target 3: Rs. 19.50
- Ultimate Target: Rs. 21.80
Technical Considerations
- Bullish divergence supports the recovery thesis.
- The 0.382 Fibonacci retracement at Rs. 11.86 has been tested.
- Consolidation around the golden zone could precede a continuation move.
- A breakout from the consolidation range would strengthen the bullish setup.
- A breakdown toward the stop-loss area would weaken the bullish structure.
The current price shown on the chart is Rs. 12.41, below the planned entry of Rs. 13.50. Consider adding within the marked consolidation zone only according to a defined execution plan, and maintain strict risk management.
AlphaEdge_Trading — Technical analysis and disciplined risk management.
⚠️ This post reflects the author’s personal opinion and is for informational purposes only. It does not constitute financial advice. Investing involves risk and should be done independently. Read full disclaimer →




Leave a Reply