
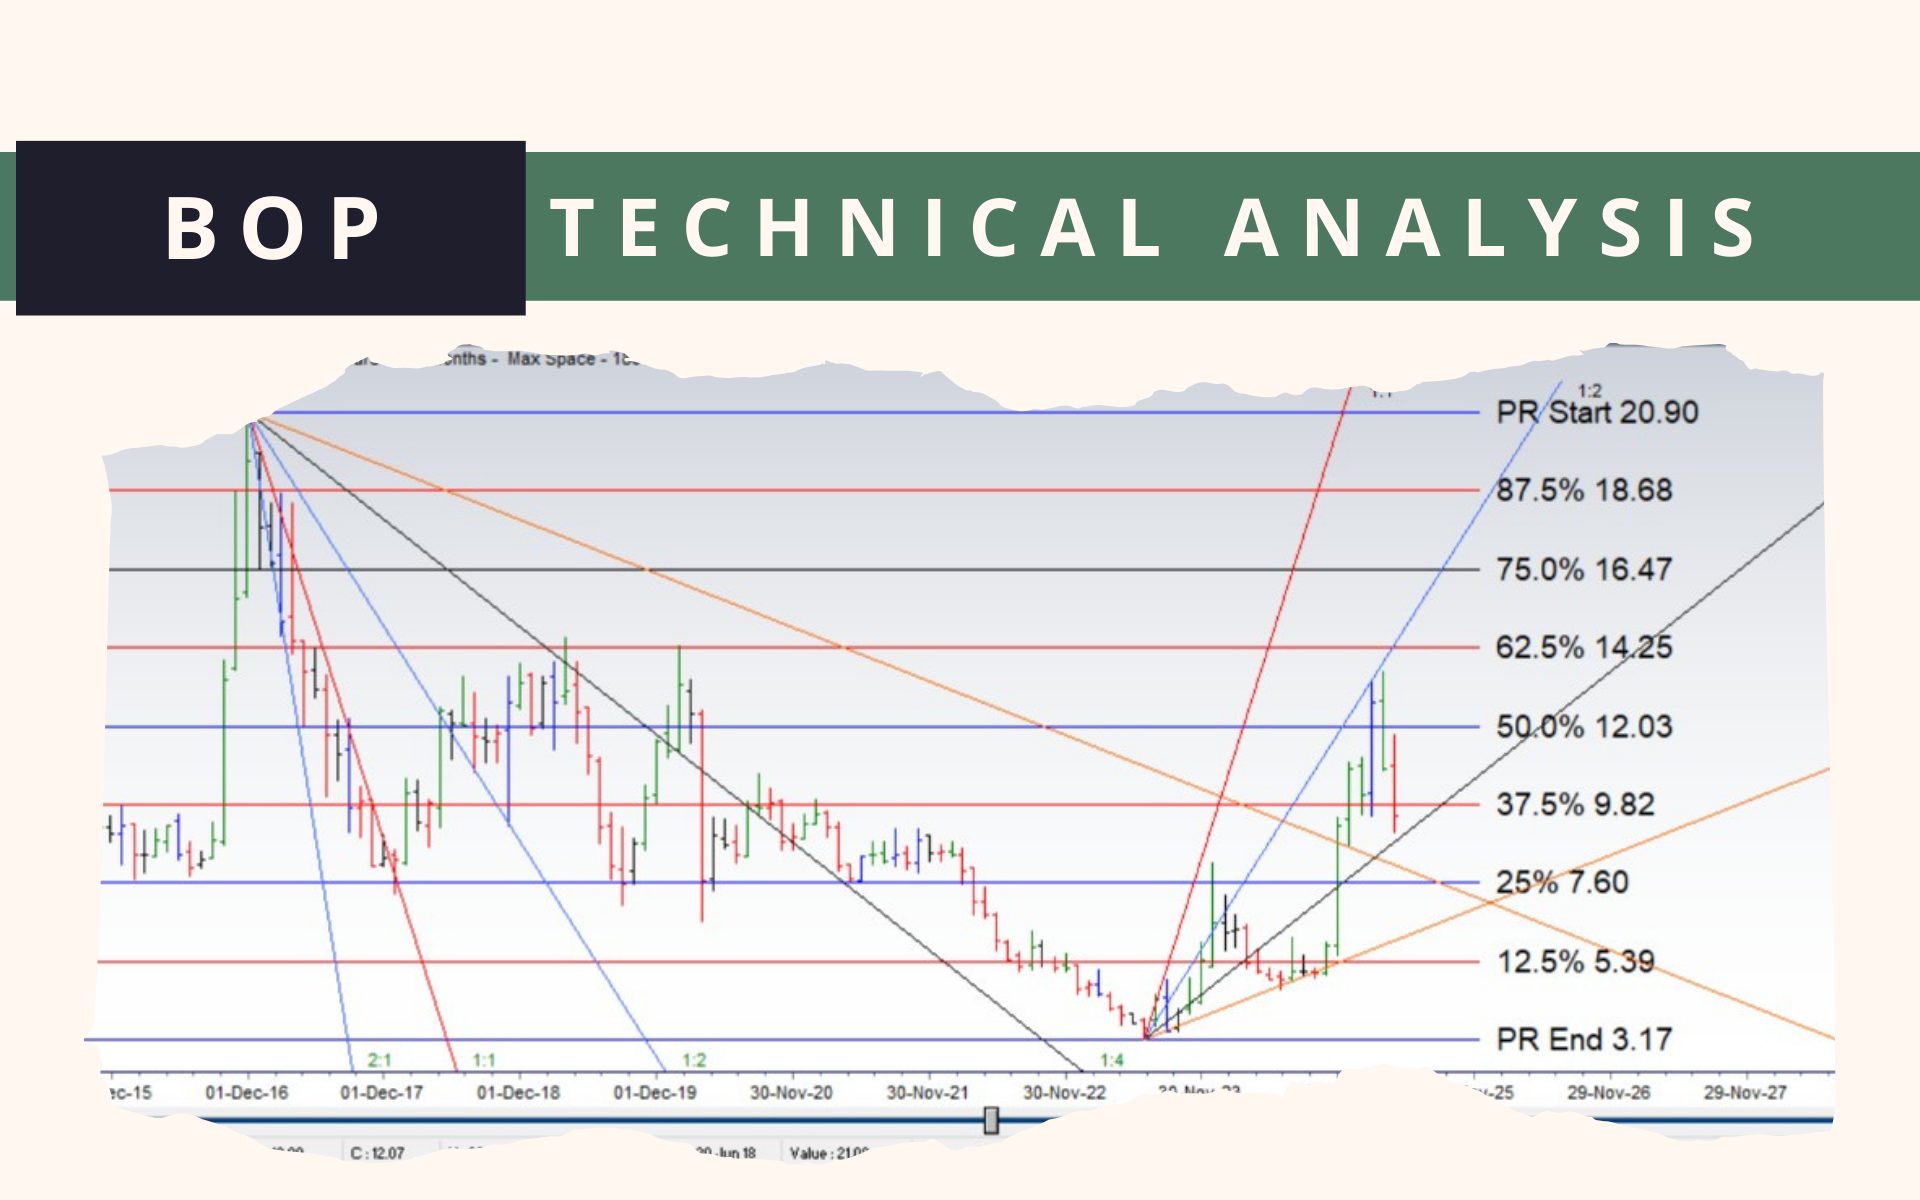
BOP Technical Analysis
BOP price range on monthly chart: 17.73
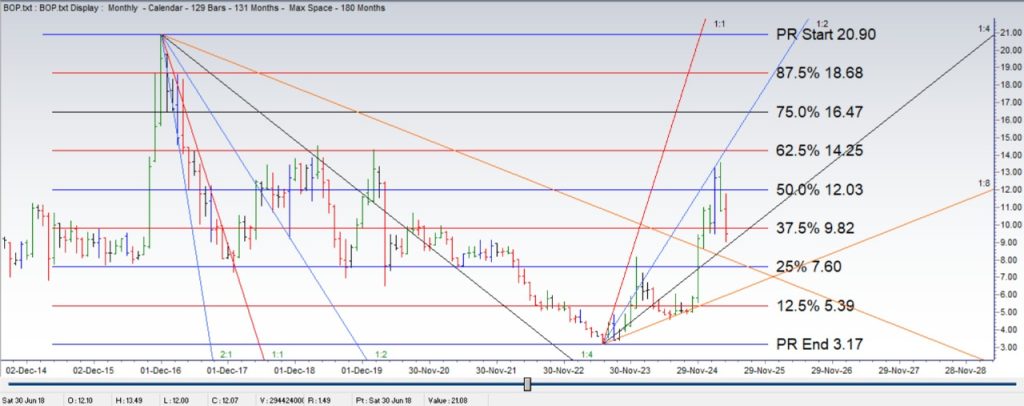
BOP price range on monthly chart: 17.73
June 2023 Low 3.17
November 2016 High 20.90
(20.90-3.17=17.73)
50% of this Range was at 12.03
As a normal rule, when stock reaches 50% of its range for the first time, it bounces back for a correction, which is evident from the monthly chart.
From 3.17, low supporting angles are 1:4 and 1:8
Financial Overview (FY 2024)
- Pre-Tax Profit: PKR 24.56 billion — the highest in the bank’s history.
- Net Income: PKR 5.33 billion in Q1 2025, up from PKR 3.51 billion in the previous quarter.
- Total Deposits: Increased to PKR 1.71 trillion from PKR 1.52 trillion in 2023, with current account deposits rising 24% to PKR 354 billion.
- Total Assets: Expanded to PKR 2.38 trillion.
Key Financial Ratios
- P/E Ratio (TTM): 2.21 — indicating potential undervaluation.
- P/B Ratio: 0.27 — suggesting the stock is trading below its book value.
- Dividend Yield: 19.35% with an annual dividend of PKR 1.80 per share.
- Dividend Payout Ratio: 24.84%, indicating a sustainable dividend policy.
Operational Efficiency
- Cost-to-Income Ratio: Improved to 60.76% (adjusted) in 2024.
- Administrative Cost-to-Gross Revenue Ratio: 12.2%, compared to the industry average of 15.0%.
- Cost per Employee: PKR 2.4 million, below the peer average of PKR 3.6 million.
- Cost per Branch: PKR 45.5 million, compared to the peer average of PKR 56.3 million.
📌 Investment Considerations
- Valuation: The low P/E and P/B ratios suggest that the stock may be undervalued, presenting a potential buying opportunity.
- Dividend Income: A high dividend yield of 19.35% offers attractive income for investors.
- Operational Efficiency: Improved cost metrics indicate strong management and operational efficiency.
- Growth Prospects: The bank’s expansion in deposits and assets, along with strategic investments, positions it well for future growth
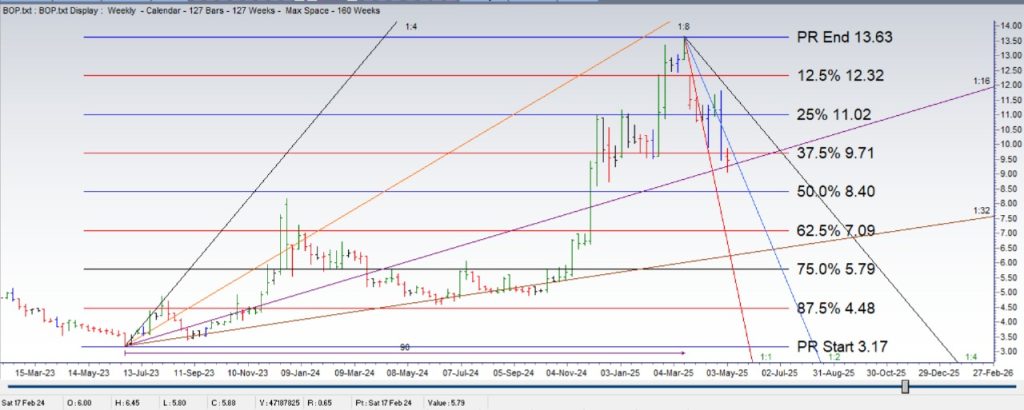
BOP weekly chart
BOP price range of 10.46 in 90 weeks
June 2023 Low 3.17
March 2025 High 13.63
(13.63-3.17=10.46)
50% of this Range was at a price of 8.40
From 3.17, low supporting angles are 1:16 and 1:32
Look for reversal when price reaches an important angle and an important range percentage.
⚠️ This post reflects the author’s personal opinion and is for informational purposes only. It does not constitute financial advice. Investing involves risk and should be done independently. Read full disclaimer →


Leave a Reply