
Netsol stock on a temporary hiatus, but a fresh rally awaits
On the monthly time frame, NetSol Technologies Limited (NETSOL) has a history of boom and bust cycles

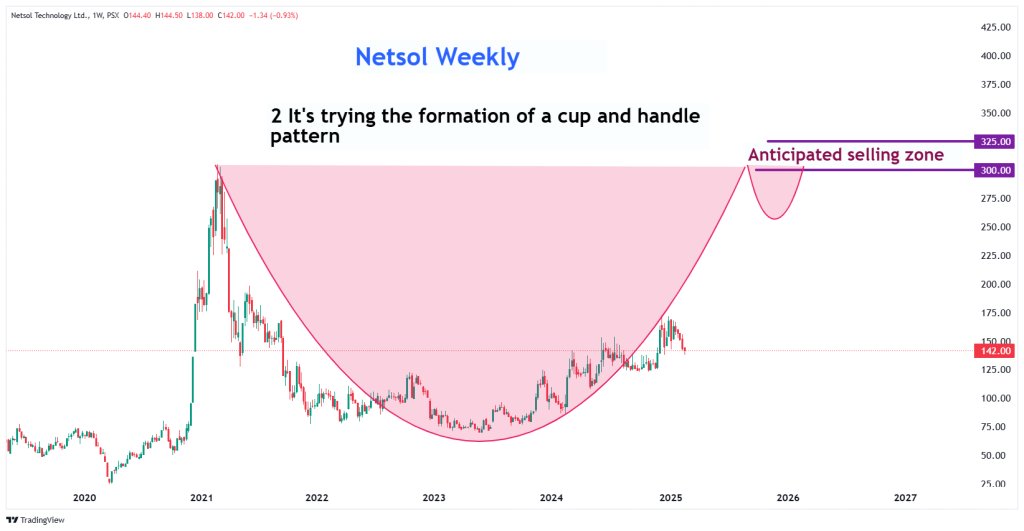
The weekly chart tells a unique story. The way it’s hovering suggests it might retest its previous all-time high of 304, though it may or may not break it.
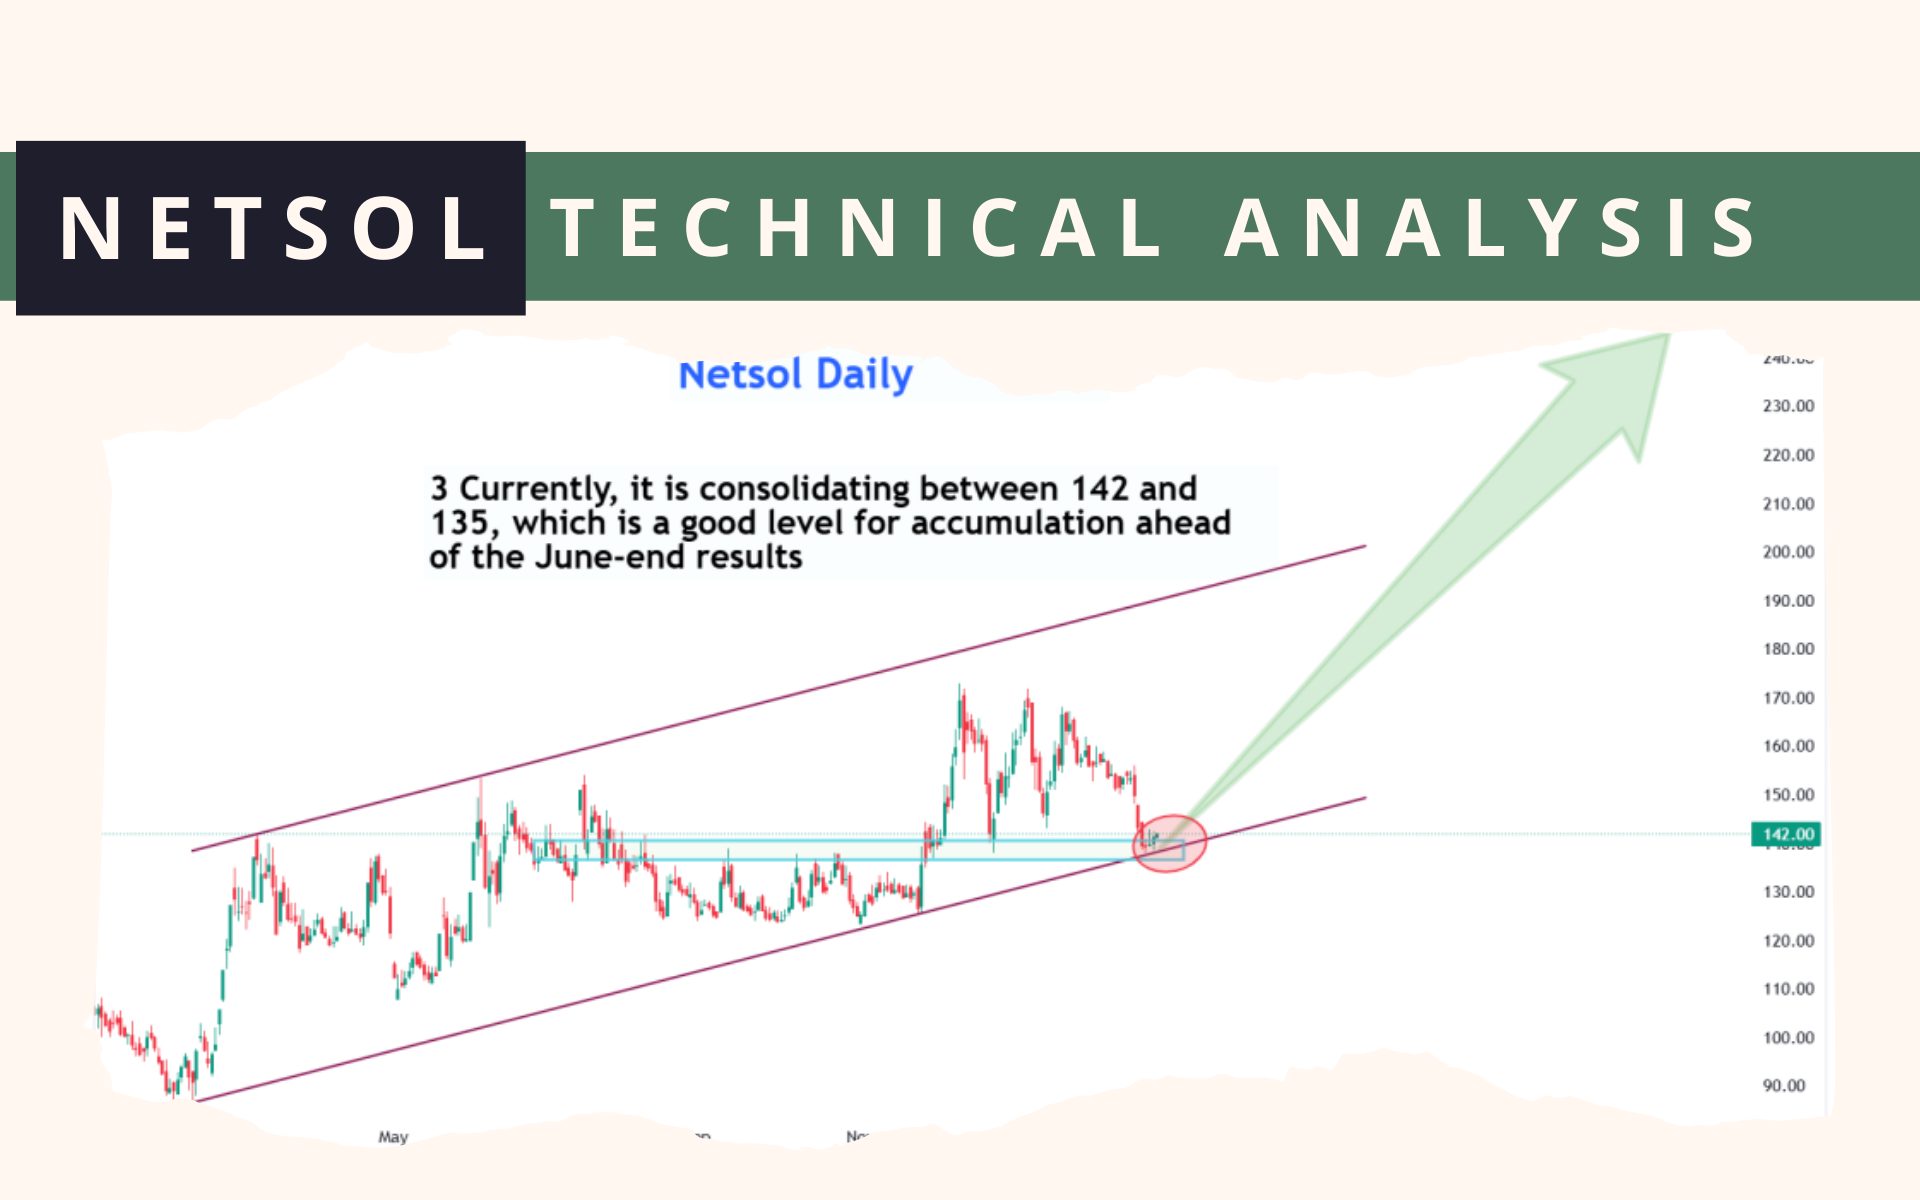
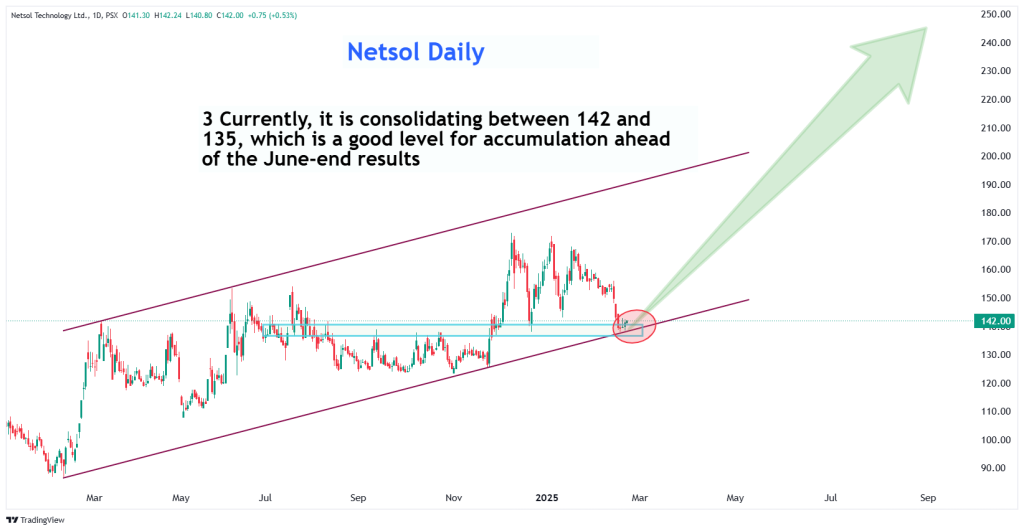
On the daily time frame, it is in the accumulation phase, with the 142-135 range being a very good buy zone.
A trend change would occur if it breaks the 124 level and closes below it on the daily time frame.
Its current small profit-taking zones are 150, 158, 165, and 170.
However, if it closes above 205, the new rally could lead it toward 280-300
Disclaimer
Always take the trade with your own risk appetite.
Before taking any trade do your own research first.
Financial markets are inherently risky.
⚠️ This post reflects the author’s personal opinion and is for informational purposes only. It does not constitute financial advice. Investing involves risk and should be done independently. Read full disclaimer →


Comments (3)
HI Hafsa can i contact you
Yes msg me in Instagram
netsol doesnt have a good repo, recently i read it was in a loss, and still its shares are in good sale