
OGDC: The People’s Choice for All-Time Stock
OIL & GAS EXPLORATION COMPANIES (OGDC) have made good corrections but it is still in the confused stage neither going up nor down.
If it doesn’t break the 192 level, it won’t correct further to the 180-176 range.
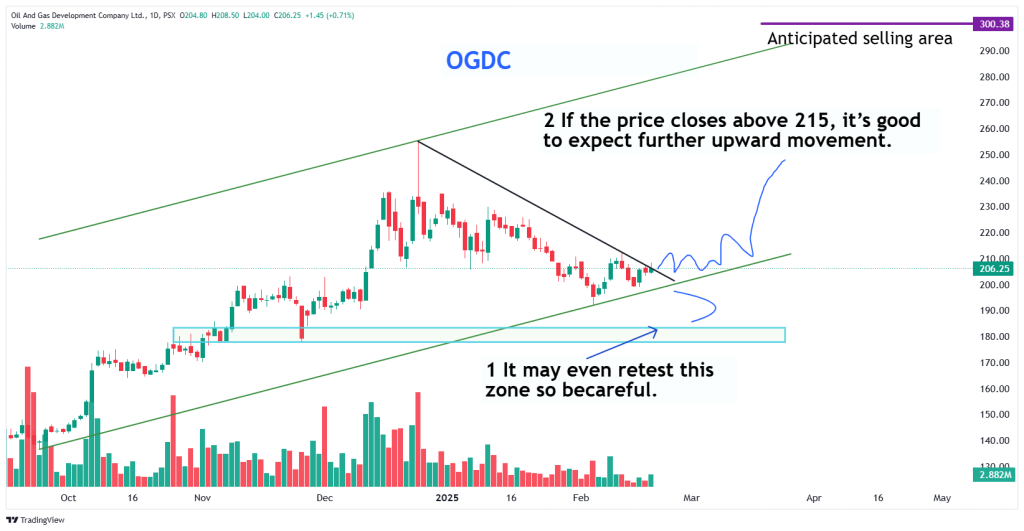
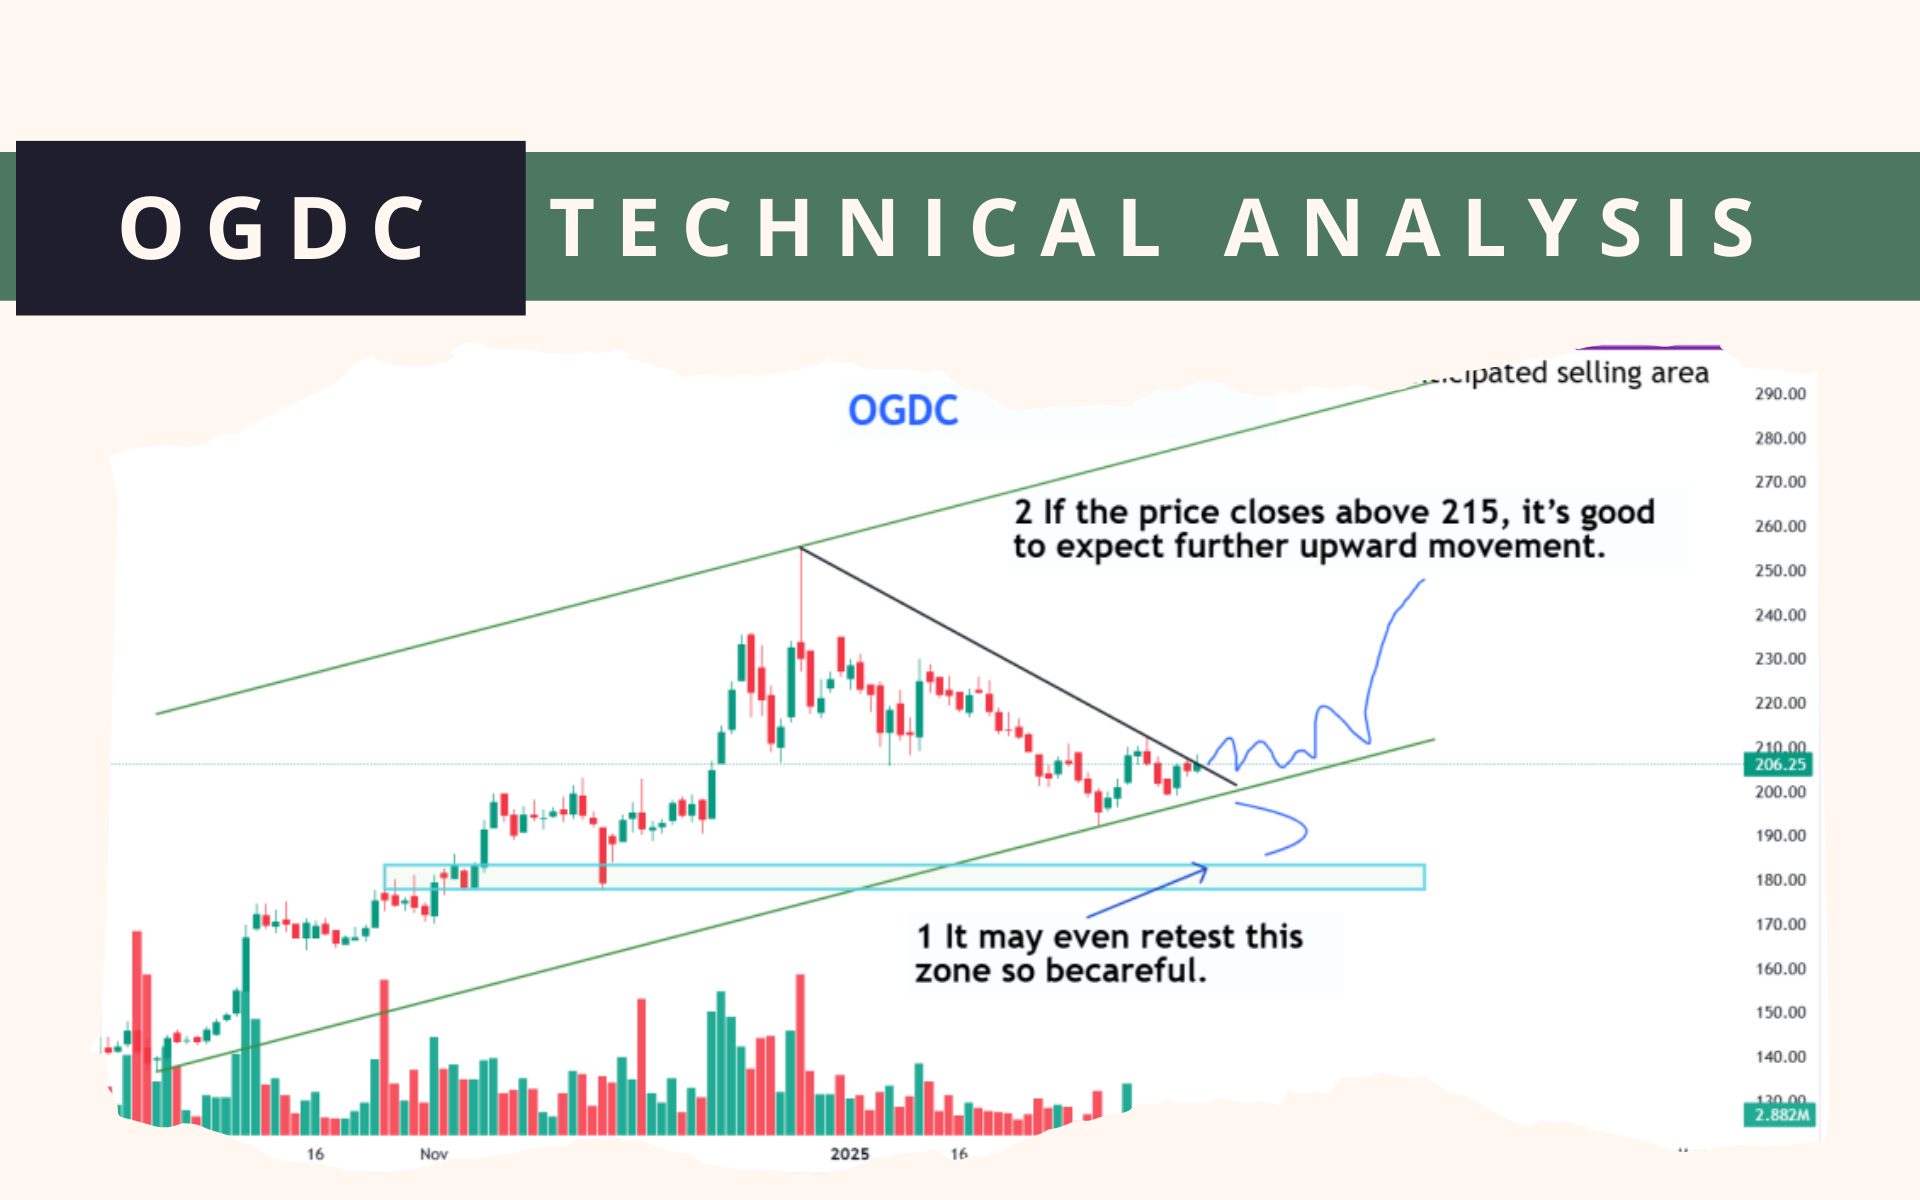
Accumulate within the range of 203-196.
It has an initial resistance of 215. The range between 230-240 is a good area for securing profits.
Ultimate target areas 290-300
For a short-tempered person, the stop-loss is at 190. However, for a long swing trade, if OGDC breaks the 170 level, the trend will change.”
Disclaimer
Always take the trade with your risk appetite.
Before taking any trade do your research first.
Financial markets are inherently risky.
Open a PSX account — get our full data service, free
Brokerage via JS Global Capital Ltd. All of the following is included at no additional cost for account holders:
| 🎯 Analyst TPs Consensus TPs from multiple brokerage houses with implied upside vs KSE-100 | 📈 EPS forecasts & forward P/E Multi-year earnings projections with historic PE percentile for valuation context |
| 💰 Dividend forecasts Forward DPS and dividend yield expectations compiled from broker research | 🤖 AI research tool NotebookLM-powered tool to analyse PSX stocks using broker research data |
“Long-term target prices take a long time to achieve.”
⚠️ This post reflects the author’s personal opinion and is for informational purposes only. It does not constitute financial advice. Investing involves risk and should be done independently. Read full disclaimer →


Comments (2)
I am new to the investing side and has been studying various tech and fundamental Analysis. Still trying to grasp the idea and relation between market sentiment and tech analysis. If buyers and sellers decide to make an entry, than it must be based upon the 1) news 2) financial 3) EPS 4) pol situation 5) Dollar stability and so much other factors. Now you having the extensive experience of charts, May I ask how tech charts help predict or foresee the forthcoming move?
Please review my previous posts where I shared the monthly, weekly, and daily charts, along with marked zones and insights on human behavior.
Nothing is 100% reliable in financial markets. You have 20% news, 20% sentiment, 20% fundamentals, 20% psychological levels, and 20% uncertainty that you will always face.
Technical charts reflect past performance and show us price behavior before a fundamental event even occurs. For example, SSGC priced in and had a strong rally before its result was announced, which showed an EPS of 4