
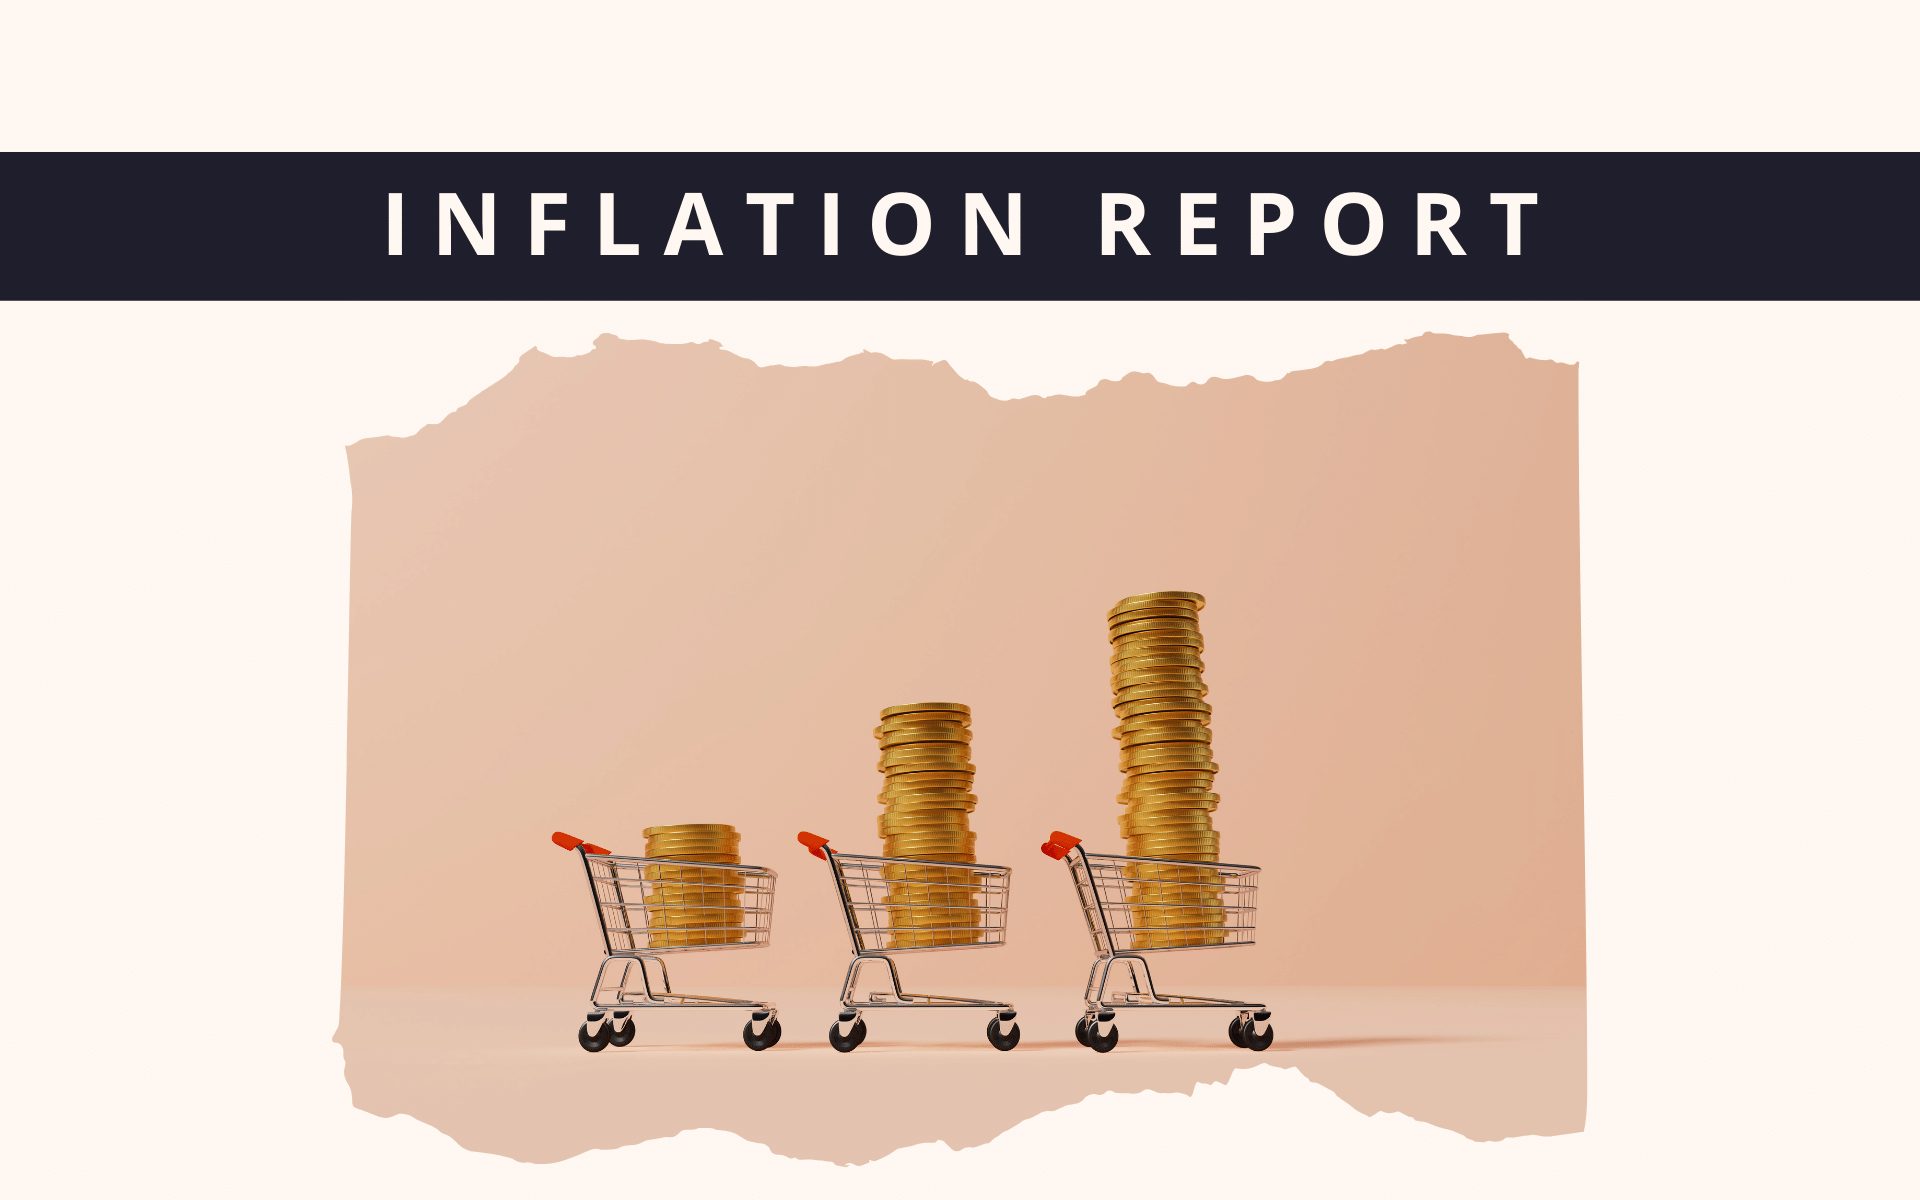
Pakistan’s March 2024 inflation report
The Pakistan Bureau of Statistics (PBS) has recently released the March 2024 National Consumer Price Index (CPI) figures. Here’s a breakdown of the key findings:
- Monthly and Yearly Comparison: The National CPI for March 2024 registered a month-on-month (MoM) increase of 1.7% and a year-on-year (YoY) surge of 20.7%. This compares to 3.7% MoM and 35.4% YoY recorded in March of the previous year.
- Urban vs. Rural Inflation: Urban CPI rose by 1.4% MoM and 21.9% YoY, while Rural CPI increased by 2.1% MoM and 19.0% YoY during the same period.
Contributors to Inflation
- Food and Non-Alcoholic Beverages: This category, accounting for 34.6% of the CPI basket, had the most significant impact on inflation. It contributed 1.1% MoM due to rising prices of perishable food items like tomatoes, onions, potatoes, fresh fruit, and vegetables, which surged by 22.7% MoM. However, non-perishable food items saw a slight decline of -0.1% MoM.
- Housing, Water, Electricity, Gas & Fuels: With a weight of 23.63% in the CPI, this index increased by 0.3% MoM, primarily due to higher electricity charges amid increased Fuel Charges Adjustment.
- Core Inflation: Urban Core Inflation (excluding food and energy) stood at 0.1% MoM and 12.8% YoY, while Rural Core Inflation was at 0.8% MoM and 20.0% YoY in March 2024.
Inflation Outlook for FY24
Looking ahead, inflation is expected to remain elevated in FY24, although lower compared to FY23. Factors contributing to this outlook include:
- Upwards revision in electricity and gas tariffs as per IMF program conditions.
- Pass-through effects of high international oil prices amid tensions in the Middle East.
- High food inflation.
- Second-round effects of PKR devaluation.
However, the moderating influence of the high base effect during the fourth quarter of FY24 is anticipated. It’s projected that FY24 inflation will average around ~24.5% YoY, compared to 29.2% in FY23.
| Group | Weight (%) | MoM (%) | YoY (%) | Impact MoM (%) | Impact YoY (%) |
|---|---|---|---|---|---|
| General | 100.00 | 1.71 | 20.68 | 1.71 | 20.68 |
| Food & Non-alcoholic Bev | 34.58 | 2.91 | 17.22 | 1.10 | 6.80 |
| – Non-perishable Food items | 29.60 | -0.29 | 13.28 | -0.09 | 4.53 |
| – Perishable Food items | 4.99 | 22.74 | 42.15 | 1.20 | 2.27 |
| Alcoholic Bev. & Tobacco | 1.02 | 0.05 | 3.59 | 0.00 | 0.06 |
| Clothing & Footwear | 8.60 | 1.65 | 16.10 | 0.12 | 1.24 |
| Housing, Water, Electricity, Gas & Fuels | 23.63 | 1.50 | 36.60 | 0.33 | 7.06 |
| Furnishing & Household Equip. Maint | 4.10 | 0.85 | 20.56 | 0.04 | 0.85 |
| Health | 2.79 | 0.55 | 19.63 | 0.01 | 0.49 |
| Transport | 5.91 | -0.15 | 11.16 | -0.01 | 0.84 |
| Communication | 2.21 | 0.07 | 14.61 | 0.00 | 0.17 |
| Recreation & Culture | 1.59 | 0.10 | 24.68 | 0.00 | 0.37 |
| Education | 3.79 | 0.72 | 12.34 | 0.02 | 0.36 |
| Restaurant & Hotels | 6.92 | 0.82 | 18.85 | 0.06 | 1.33 |
| Miscellaneous | 4.87 | 0.78 | 22.00 | 0.04 | 1.11 |
Source: PBS, Foundation Research, April 2024
Disclaimer: The information in this article is based on research by Foundation Securities. All efforts have been made to ensure the data represented in this article is as per the research report. This report should not be considered investment advice. Readers are encouraged to consult a qualified financial advisor before making any investment decisions.
⚠️ This post reflects the author’s personal opinion and is for informational purposes only. It does not constitute financial advice. Investing involves risk and should be done independently. Read full disclaimer →


Leave a Reply