
Posted by: Hafsa Talpur
Post Date: May 12, 2025
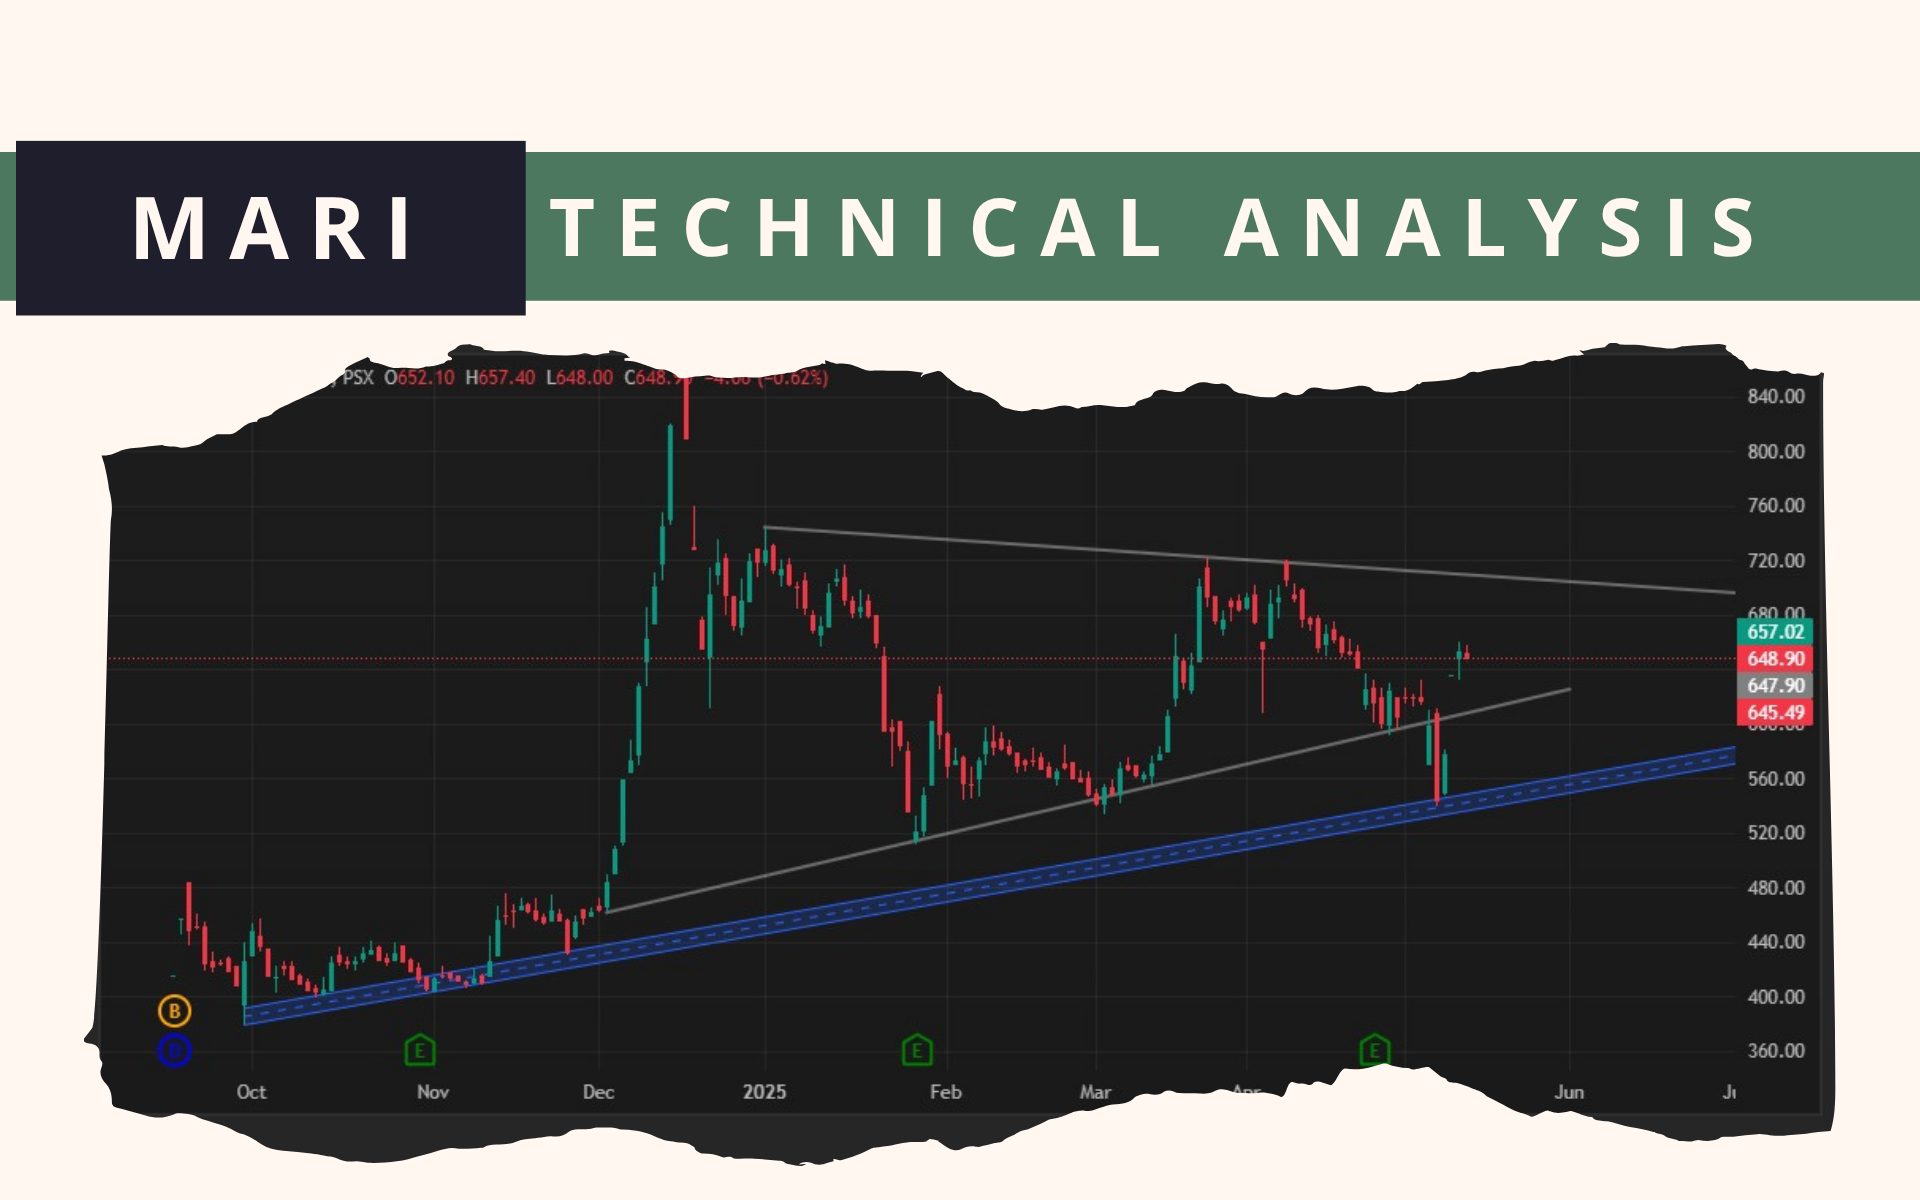
MARI Technical Analysis
Currently, the market has tested a daily support trendline with a big inefficiency.
The secondary trendline is also broken on the daily timeframe, and the market trades above that trendline.
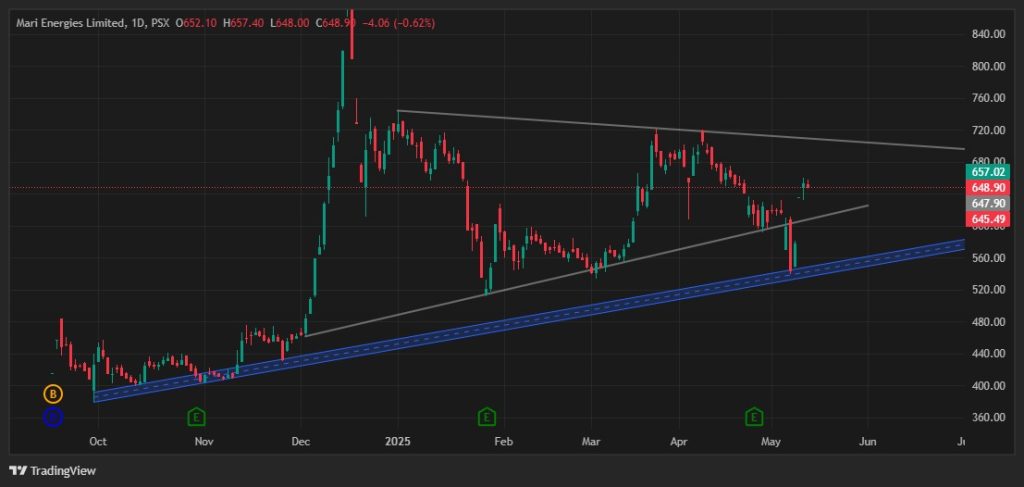
There are Equal Highs on a 15M timeframe, which is at 660rs.
Still, there is a liquidity below 648; afterwards, there is a bullish engulfing.
Stoploss can be seen around 345 for the short term.
📢 Announcement: You can now access our services and similar analyses by opening an account with us via JS Global

⚠️ This post reflects the author’s personal opinion and is for informational purposes only. It does not constitute financial advice. Investing involves risk and should be done independently. Read full disclaimer →


Comment (1)
Your analysis are amazing 🙂