
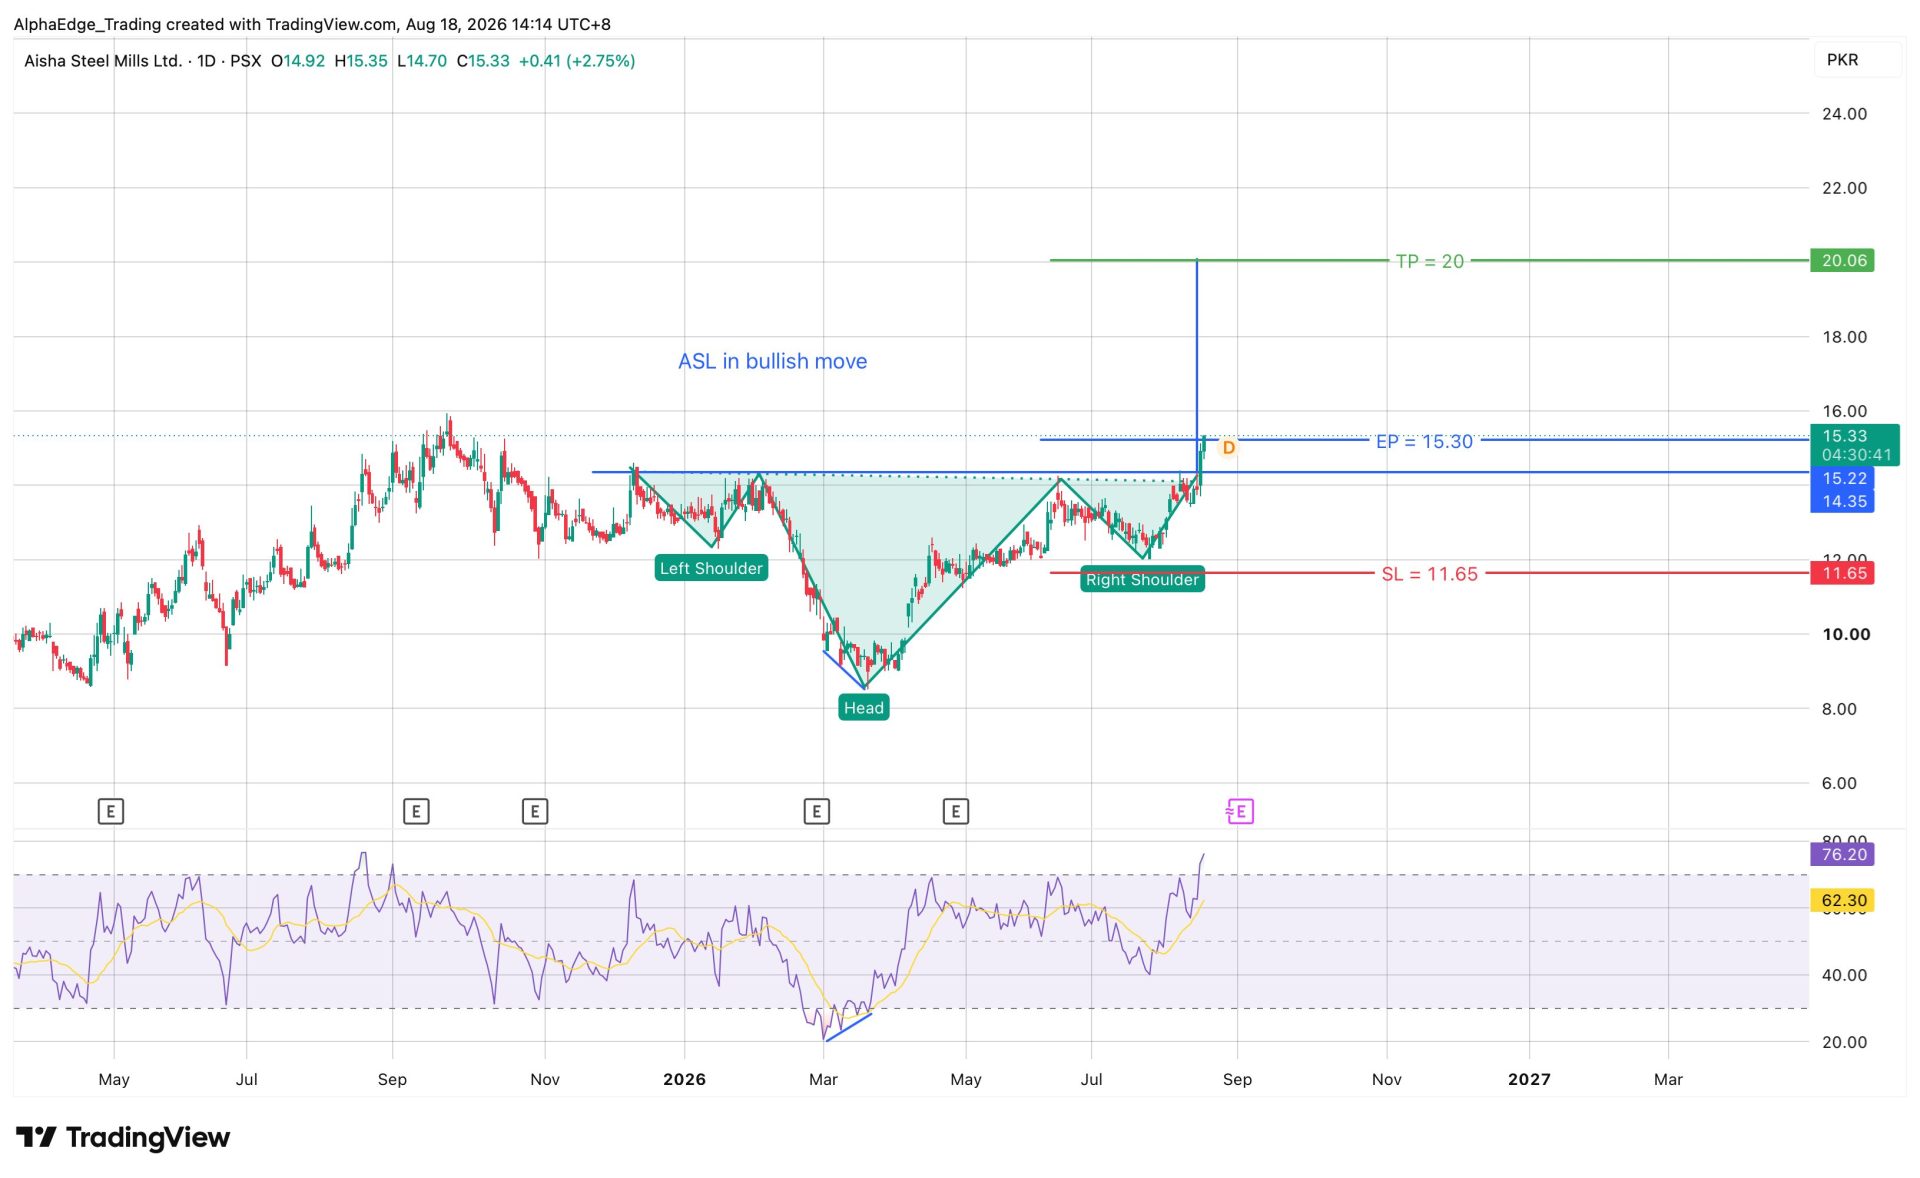
ASL – Aisha Steel Mills Ltd. | Inverted Head & Shoulders Pattern
ASL Technical Analysis – Inverted Head & Shoulders Breakout
Disclaimer: This analysis is for educational purposes only and reflects a technical market opinion, not investment advice.
ASL has formed an Inverted Head and Shoulders pattern on the daily timeframe and has moved above the neckline resistance around 14.50.
The neckline breakout is a positive technical development and suggests a potential bullish reversal in the prevailing price structure. The current price around 15.30 is trading above the breakout area, indicating that buyers have maintained control following the pattern confirmation.
Key Technical Levels
- Neckline / Breakout Level: 14.50
- Current Price: 15.30
- Key Risk Level: 11.65
- Potential Target: 20.00
As long as ASL sustains the breakout structure above the 14.50 neckline, the technical outlook remains constructive, with 20.00 emerging as an important upside level to monitor.
Risk & Potential Return
Using the current price of 15.30 as the reference:
- Potential downside toward 11.65: ~23.86%
- Potential upside toward 20.00: ~30.72%
- Approximate reward-to-risk relationship: 1 : 1.29
Technical View
- The Inverted Head and Shoulders formation provides the primary bullish structure.
- 14.50 is an important level to monitor following the neckline breakout.
- Sustaining price above the breakout zone would support the continuation of the bullish outlook.
- 11.65 remains an important structural level; a sustained breakdown below it would weaken or invalidate the current pattern.
- 20.00 is the major projected upside level based on the pattern structure.
Price confirmation and proper risk management remain important, particularly because the setup carries a relatively wide distance between the current price and the structural risk level.
⚠️ This post reflects the author’s personal opinion and is for informational purposes only. It does not constitute financial advice. Investing involves risk and should be done independently. Read full disclaimer →


Leave a Reply