
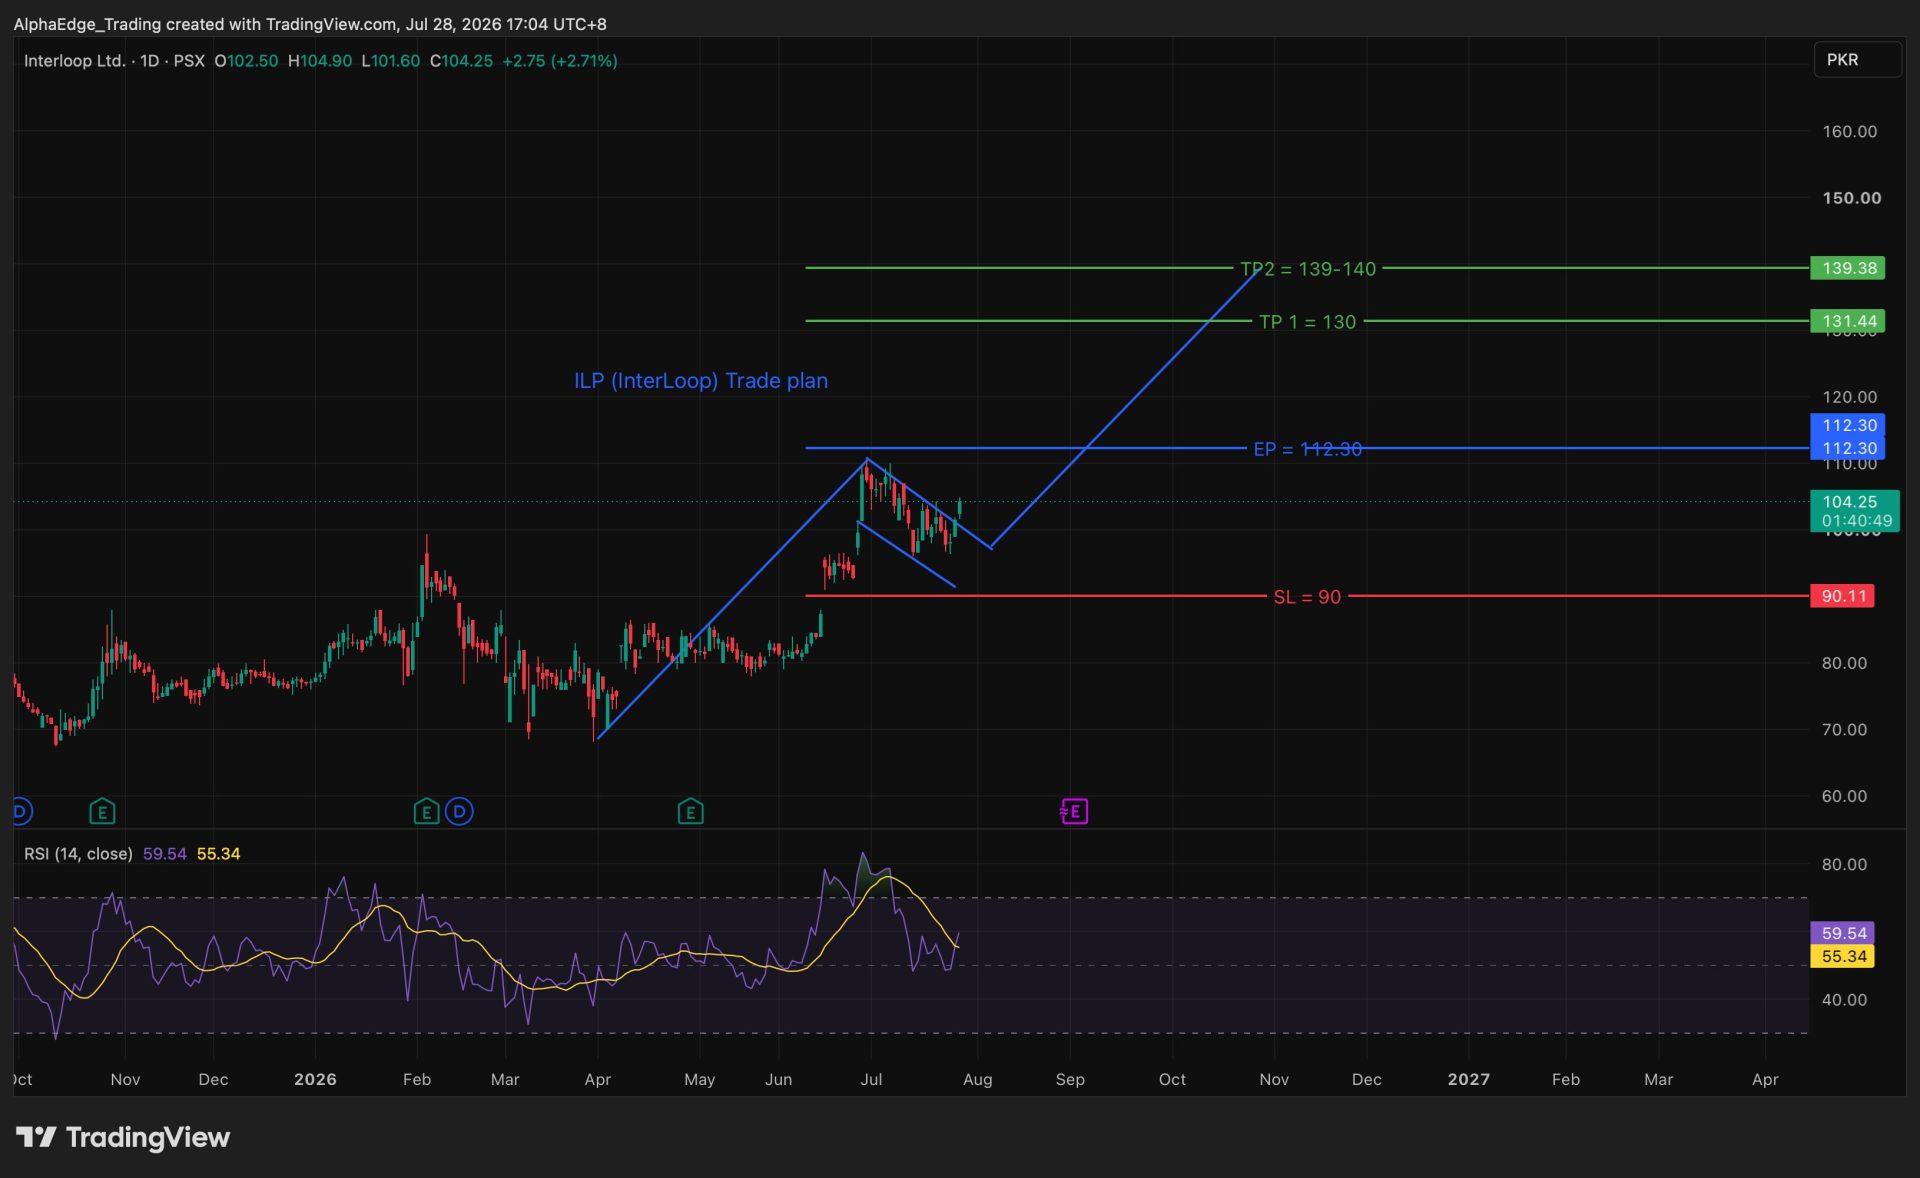
ILP InterLoop – with Dual Entry setup
ILP Technical Analysis – Bullish Flag / ABCD Pattern with Dual Entry Strategy
📊 ILP Technical Outlook – Bullish Flag / ABCD Pattern
ILP is currently forming either a Bullish Flag or an ABCD Harmonic Pattern, both of which suggest the possibility of trend continuation if the pattern is confirmed.
There are two technical scenarios worth monitoring:
📌 Scenario 1 – Current Price Zone
The current market price around 101–104 appears to be an attractive accumulation zone from a technical perspective. Traders looking for an early position may find this area favorable, provided they manage their risk appropriately.
The 110 level is an important resistance and may be a reasonable area to consider partial profit booking. If price manages to break above this level with strength, it would further improve the bullish outlook.
📌 Scenario 2 – Breakout Confirmation
For those who prefer confirmation over early accumulation, 112.10 is an important breakout level to watch. A decisive breakout above this price, ideally supported by strong volume, would strengthen the probability of a continuation towards higher targets.
🛑 Risk Management Level: 90.00
🎯 Potential Resistance / Target Levels:
• 110 – Previous High / Breakout Level
• 130 – First Major Resistance (~15.97% from breakout level)
• 139–140 – Ultimate Target Zone (~24.00%–24.89% from breakout level)
📈 Potential Returns
From the Current Zone (Average Price: 102.50):
• Move to 110: ~7.32%
• Move to 130: ~26.83%
• Move to 139–140: ~35.61% – 36.59%
💡 Technical View
• The 101–104 zone appears favorable for accumulation from a risk-to-reward perspective.
• 110 remains the key resistance to monitor.
• A sustained move above 112.10 would confirm the bullish continuation pattern and improve the probability of reaching higher resistance levels.
• As always, disciplined risk management remains more important than chasing price.
📌 This analysis is shared for educational purposes only and reflects a technical market view, not financial advice. Always conduct your own research before making any investment decisions.
⚠️ This post reflects the author’s personal opinion and is for informational purposes only. It does not constitute financial advice. Investing involves risk and should be done independently. Read full disclaimer →







Leave a Reply