
This page brings together everything you need to know about our unique database. We aggregate analyst target prices from multiple brokerage houses, EPS and dividend data, mutual fund holdings data, and convert them into simple, comparable numbers.
Instead of scanning dozens of research reports, you can quickly see what analysts are expecting, how much upside they imply, and how those expectations compare to the broader market.
You can think of our database as a structured snapshot of analyst thinking.
Currently, we compile all the data into a Google Sheet(until we can build a proper dashboard). The Google Sheet contains multiple sub-sheets and we will explain what each of them means for you.
Target Prices Compilation (TP Sheet)
This sheet contains target prices of all the brokers for all the stocks they cover, for a specific timeframe(for example, currently for Dec 2026)
The sheet answers three key questions:
- What upside are analysts implying?
- What is the consensus expectation?
- Does the stock offer better expected upside than the broader market?
How to Use the TP Sheet
Here is a sample layout of the TP Sheet
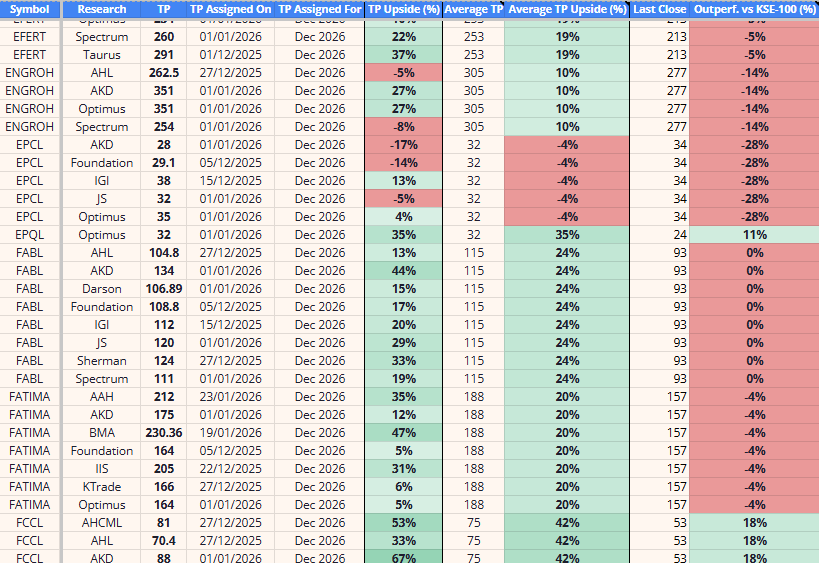
For each stock, the following info is mentioned:
- Symbol
- Research House
- Target Price (TP)
- TP Assigned On (This is the date the research was released on)
- TP Assigned For (Dec 2026 in this case)
- TP Upside (%) – this refers to the upside of each broker TP relative to the last closing price
- Average TP – this lists the average of all the TPs.
- Average TP Upside (%) -This lists the upside of the average TP, and helps in looking at the consensus at a glance
- Last Close – the latest closing share price
- Outperf. vs KSE-100 (%) – it tells you how much extra upside the stock offers, relative to the consensus upside of the KSE-100.
The average TP Upside (%) column gives you a fairly good idea of which stocks are currently offering the most upside. This does not mean you buy the stock, though. It is a great initial point to start your research. It is then up to you to figure out why the market hasn’t priced in the brokerage house’s projections.
Considering how volatile our market is, it is worth frequently checking this column to see if some stocks have fallen so much that their upside is now quite attractive.
The Outperf. vs KSE-100 (%) column is also interesting. It allows you to see which stocks offer upside in addition to the upside expected of the KSE-100 index. This is again a great starting point to research alpha stocks – stocks that outperform the index.
A general rule to see if stocks offer value is this:
- High Upside + Positive Outperformance → Valuation advantage (alpha stock)
- High Upside + Negative Outperformance → Better to just buy index or index heavyweights
- Negative Upside → Analysts imply downside risk
A stock with high upside is not automatically attractive. The relevant comparison is whether that upside exceeds the opportunity offered by the market itself.
Case Study
Take AGP as an example. In Jan 2026, the stock was trading over PKR 255, and its average target price was PKR 268. The stock had only started running up to this price after trading sideways around PKR 200 for nearly a year. As soon as brokerage research came out for 2026, the stock started pricing in the new reality and within one month closed in on the average TP.
This behaviour was also witnessed at the end of 2024 among various stocks and the index. It follows the simple stock market rule: If someone is talking about a new development, it’s always priced in. As soon as brokers release their new expectations, the investors react quickly to price it in.
The February sell-of induced by political issues and fear of Iran-US war brought many stocks down to reasonable levels. The same AGP that wasn’t offering any major upside was now trading at a 20% discount to the consensus upside expectations. This can be a great entry point for those who missed out on the first rally.
EPS Forecast Sheet (EPS FORECAST)
This sheet is designed to help investors quickly interpret earnings expectations and valuation levels using broker research. Target Prices only portray a layman understanding of stock expectations. It is the earnings epectations that investors should keep a much closer eye on.
Instead of scanning multiple reports, the sheet brings together EPS forecasts and forward and historical P/E ratios into one structured view. The goal is simple: translate analyst estimates into an easy-to-understand valuation system.
The sheet answers these key questions:
- How is the EPS expected to grow over the next few years?
- What forward Price to Earnings ratio is the stock trading at?
- Is the stock cheaper compared to historic P/E valuation?
- How much would the stock price gain for the stock to be valued at the same P/E as today?
How to Use the EPS FORECAST Sheet
Here is a sample layout of the EPS Forecast Sheet
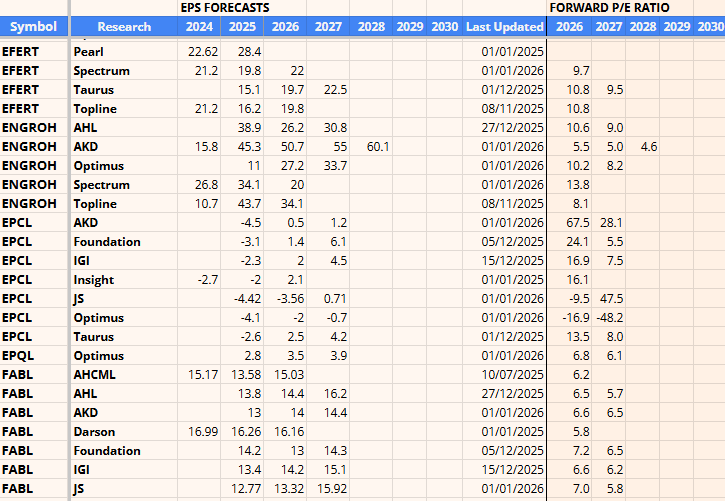
All research reports contain forward-looking data, but it can be hard to keep track of EPS projections and how they change over time. This sheet allows you to look at the forward looking EPS estimates and as a result also check the forward P/E at a glance.
We have also compiled the 5-year and 10-year average TTM Price to Earnings ratios to give you an idea of where the stocks have traded historically:
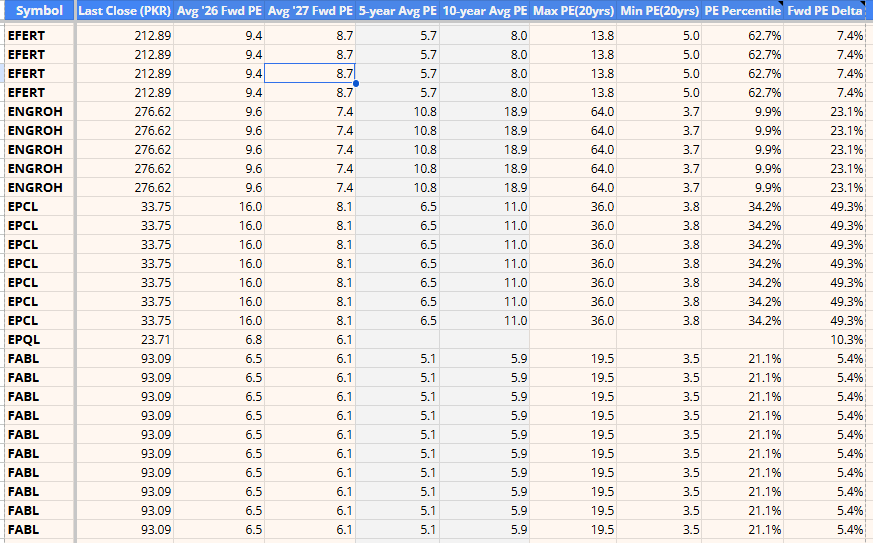
The PE percentile tells you where the stock is trading in relation to its historic 20-year high and low. A value of 1% means the stock is trading just above the minimum PE it has traded in the last 20 years. A value of 100% means the stock is trading at the highest valuation it has traded in the last 20 years.
Case Study
When SEARL did a successful turnaround of its business and reported a positive EPS, it was trading at a TTM PE of 100x. Many people thought the stock was overvalued(or typically isko brokers ooper le gaye hen maal chipkaane ke lie), expecting a crash soon.
However, one glance at the forward PE would have told you that the stock was trading at a forward PE of 20x. This is close to the historic average PE of the pharma sector. The stock wasn’t overvalued; it had simply adjusted to historic valuations.
Growing companies expected to increase their EPS significantly over the coming years often trade at a ‘growth premium’. With forward estimates, you can find out exactly what this premium is and bet accordingly. This is what the forward PE Delta column tells you. If a stock has a forward PE Delta of 25%, it means by just increasing its earnings(ie registering the growth), its stock should rise by 25% by next year if valuation is to stay the same.
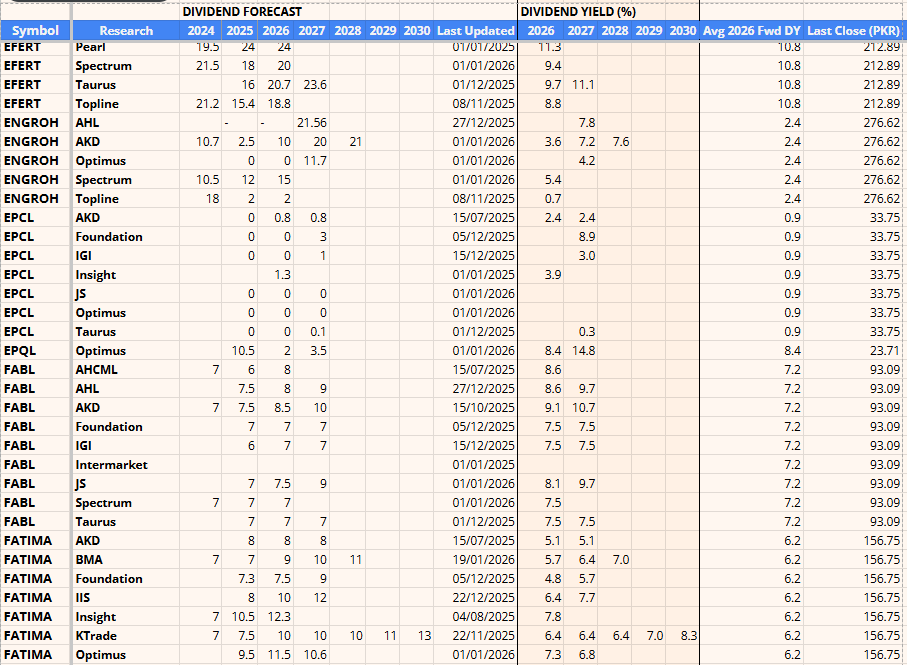
Dividend Forecast Sheet (DPS FORECAST)
The dividend forecast sheet is quite self-explanatory and simple to use. You can see dividend expectations from all the brokers, along with the dividend yield(%). The average 2026 forward DY column gives you a good idea of how much dividend to expect in the coming year. Fertilizer and Banking stocks often trade based on this metric.
Mutual Fund Data
to be added soon
NotebookLM AI Tool
A NotebookLM Tool will be available shortly. For now, you can access a trial version at: https://notebooklm.google.com/notebook/046d2c69-4eb4-4453-ac85-5754e553e5db?pli=1&addSource=true
Note: the tool currently works on PC only.
What Next For Our Subscribers?
We intend to continue adding more features to the Database over the coming months.
How To Subscribe
Access to the above database is available for an introductory price of PKR 2000/- per quarter. (see sample here: https://docs.google.com/spreadsheets/d/1Y3IFr46icFXllAHkzIpdZE4d5004jPYrCdLeJfaVUAc/edit?usp=sharing)
Access to the Notebook LM Tool is available for an introductory price of PKR 2000/- per quarter. (see sample here: https://notebooklm.google.com/notebook/046d2c69-4eb4-4453-ac85-5754e553e5db?pli=1&addSource=true)
Access to both the above tools is available for PKR 3000/- per quarter.
Please get in touch with us via WhatsApp: +923378205259

Note: The database is not meant to be used as a shortcut to generate signals or trading tips. We do not have any shortcut to operating in the market and this tool certainly isn’t meant to be used as such. The database is simply a compilation of publicly available data while the Notebook LM tool helps you with stock analysis using publicly available research data.
⚠️ This post reflects the author’s personal opinion and is for informational purposes only. It does not constitute financial advice. Investing involves risk and should be done independently. Read full disclaimer →