
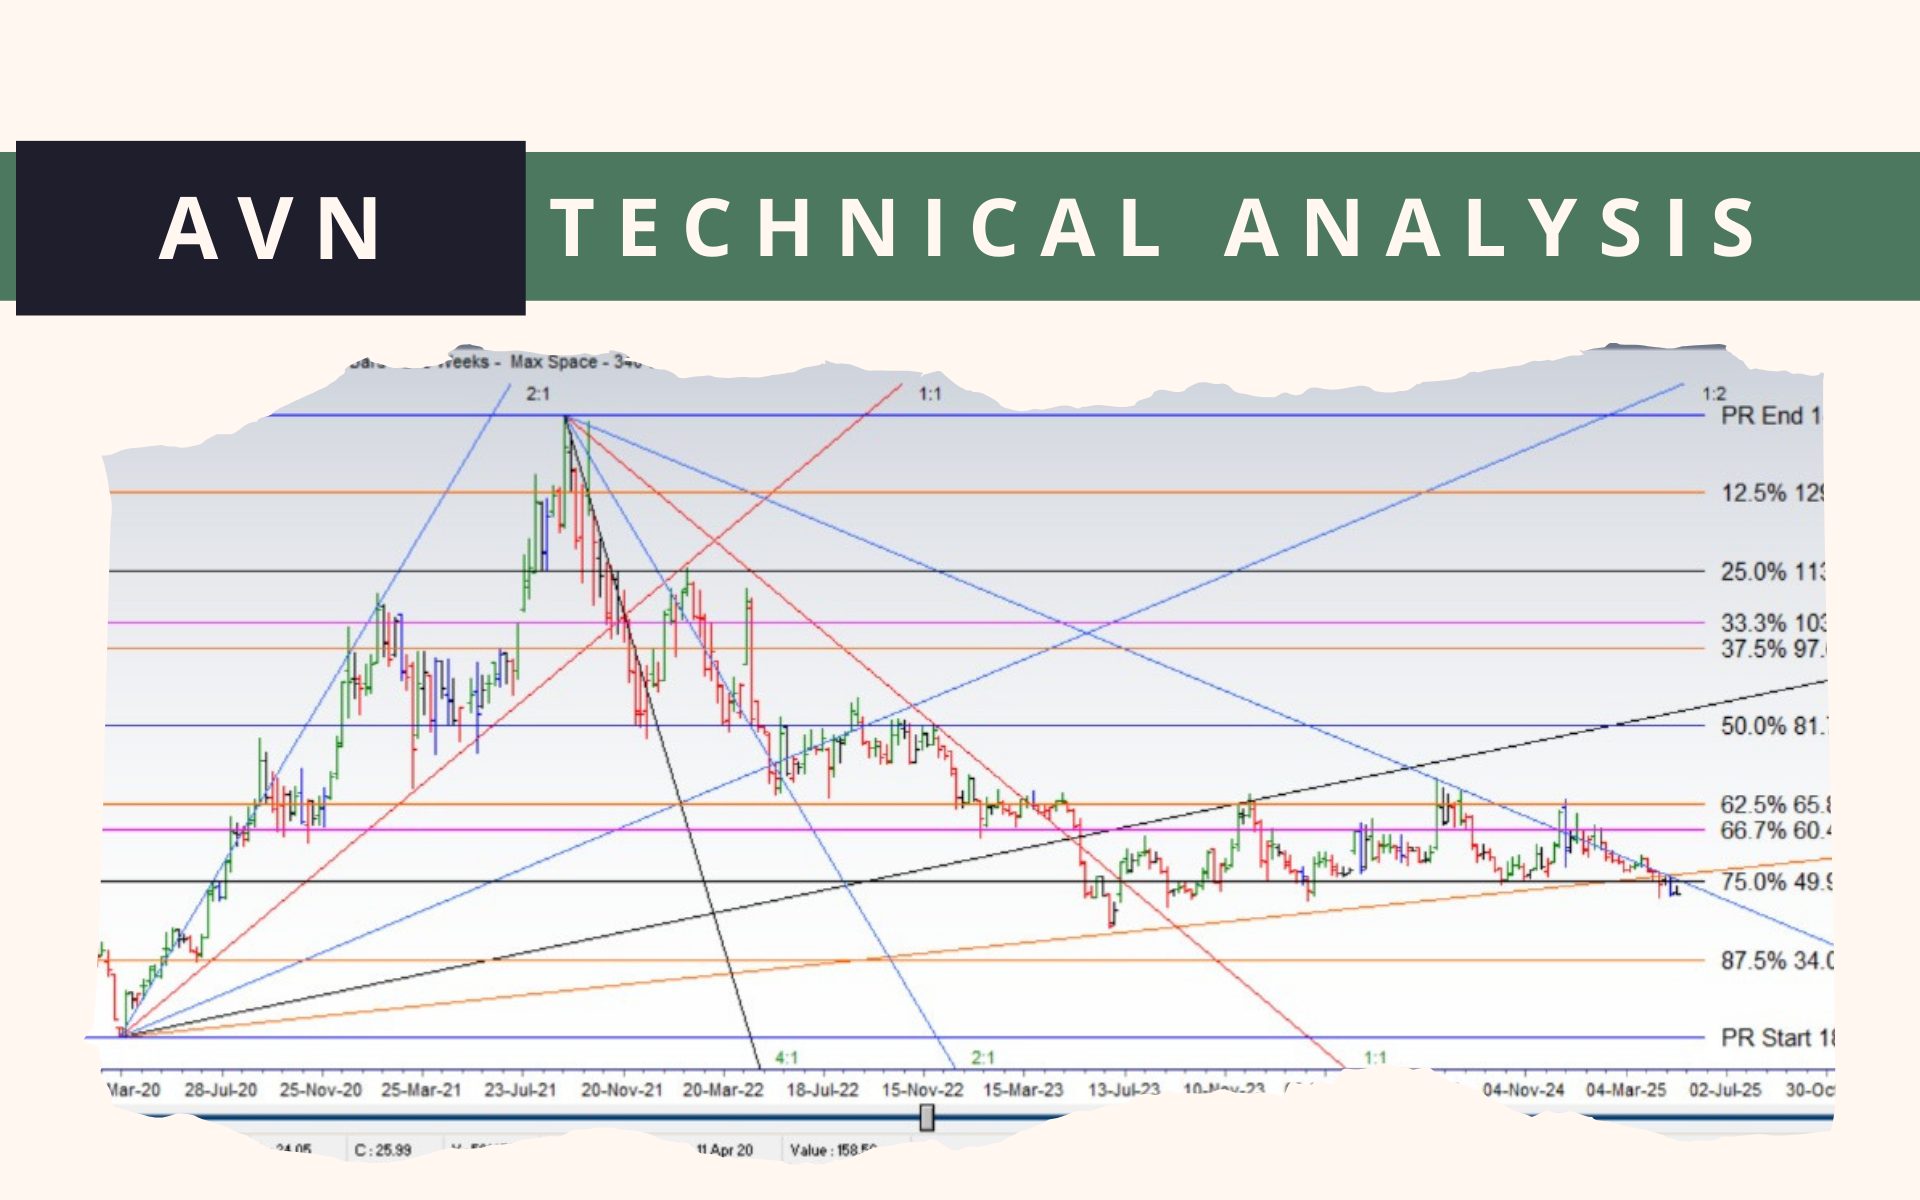
AVN Technical Analysis
AVN price range 127.3, Low March 2020 18.10
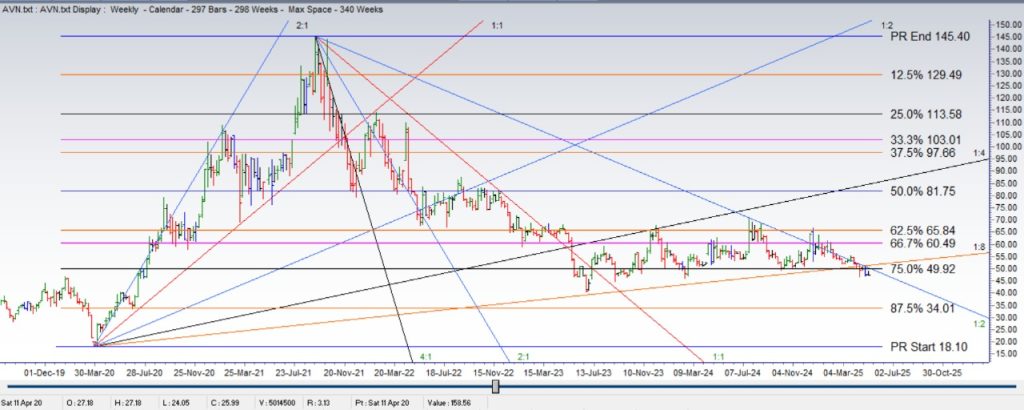
High September 2021 145.40
(145.40-18.10=127.3)
📢 Announcement: You can now access our services and similar analyses by opening an account with us via JS Global

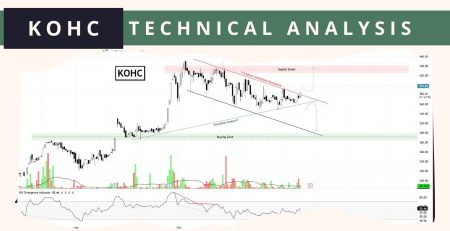
Weekly chart shows sideways price movement from 1:1 to 1:2 angle, reflecting improvement in rate of decline from the high of 145.40
Key support Areas are 75%, 49.92% and 87.5%, and 34.01% of this range
Closing above a 1:8 Angle from the low of 18.10 and a 1:2 angle from the 145.40 high will indicate a reversal in trend.
Financial Performance (FY 2024)
- Revenue: PKR 16.16 billion (YoY decline of 9.07%)
- Net Profit Margin: 14.69%
- Gross Profit Margin: 31.27%
- Return on Equity (ROE): 19.94%
- Return on Assets (ROA): 10.06%
- Book Value Per Share: PKR 35.11
- Price-to-Book (P/B) Ratio: 1.35x
- Price-to-Sales (P/S) Ratio: 1.12x
Key Financial Ratios
- Current Ratio: 1.61 (indicates adequate short-term liquidity)
- Enterprise Value to EBITDA (EV/EBITDA): 5.74x
- Earnings Per Share (EPS): PKR 4.95
📢 Announcement: We're on WhatsApp – Join Us There!

⚠️ This post reflects the author’s personal opinion and is for informational purposes only. It does not constitute financial advice. Investing involves risk and should be done independently. Read full disclaimer →

Leave a Reply